
Visão Geral
Esta estratégia é um sistema de negociação abrangente que combina vários indicadores técnicos, capturando oportunidades de negociação através do monitoramento dinâmico do momentum e das mudanças de tendência do mercado. A estratégia integra múltiplos indicadores, como o sistema de médias móveis (EMA), Índice de Força Relativa (RSI), Convergência/Divergência das Médias Móveis (MACD) e Bandas de Bollinger (BB), além de introduzir um mecanismo dinâmico de stop loss baseado no Average True Range (ATR), permitindo uma análise multidimensional do mercado e controle de risco.
Princípio da Estratégia
A estratégia adota um mecanismo de confirmação de sinais em múltiplas camadas, incluindo principalmente os seguintes aspectos:
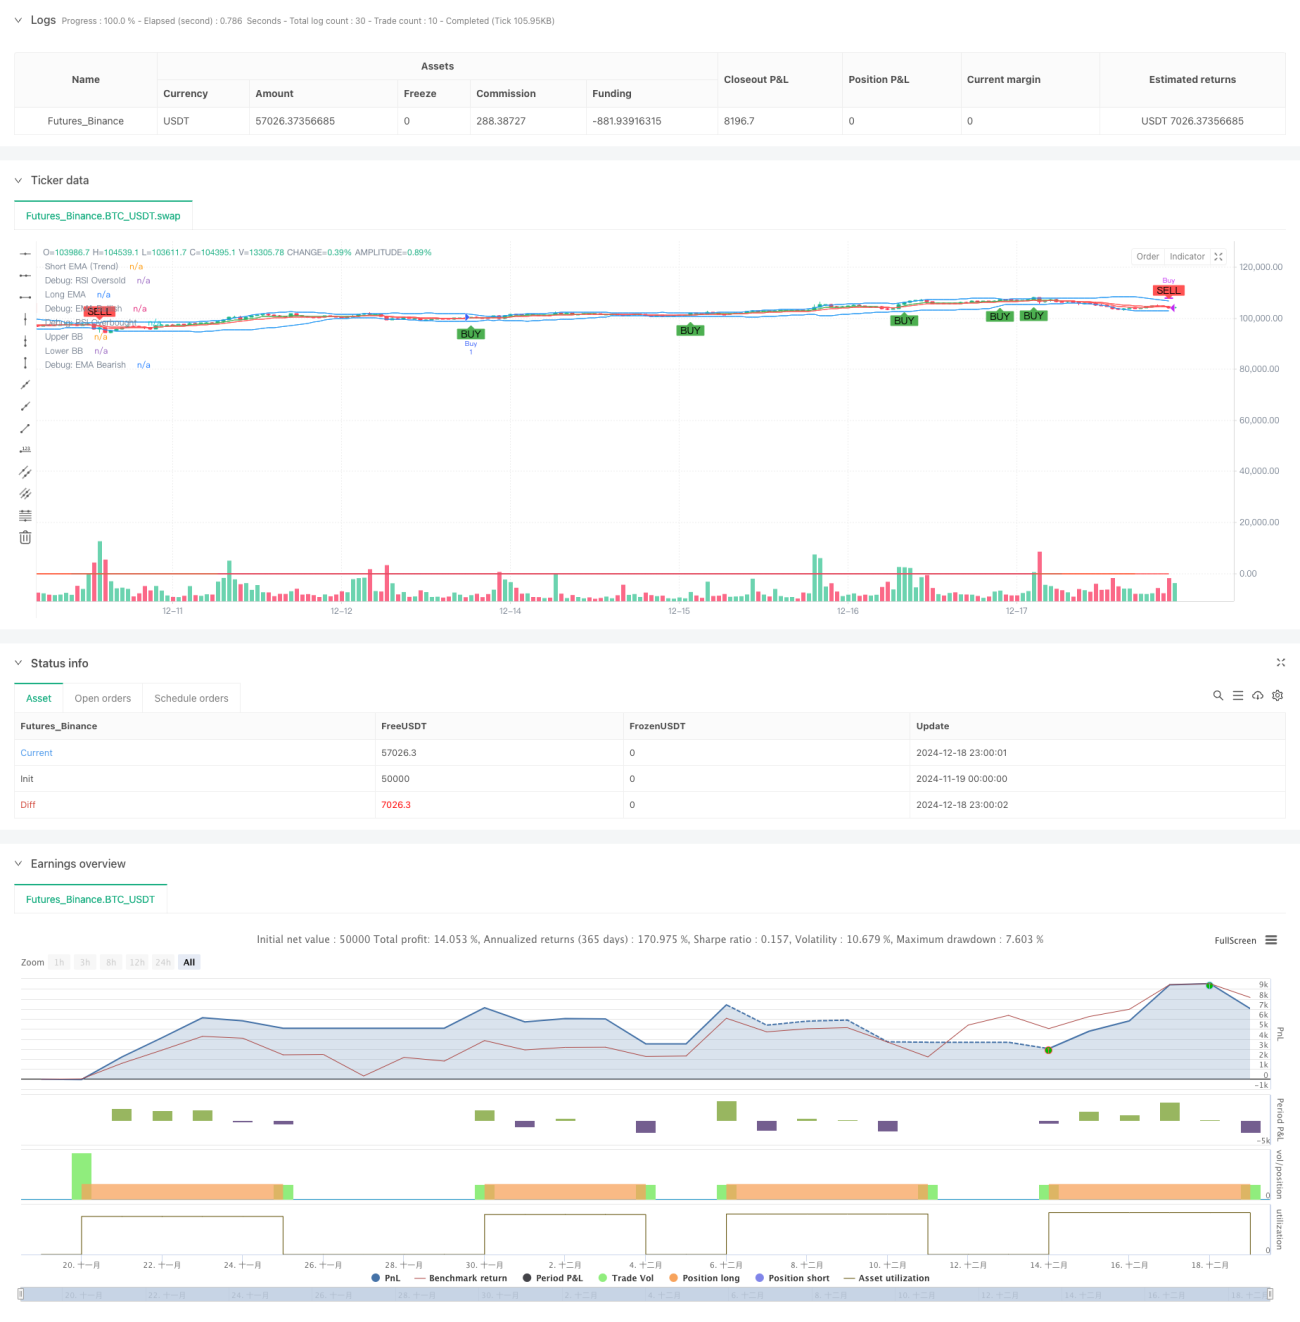
- Identificação de tendência: Utiliza o cruzamento das EMAs de 7 e 14 períodos para determinar a direção da tendência do mercado.
- Análise de momentum: Monitora as condições de sobrecompra/sobrevenda do mercado através do RSI, com limites dinâmicos de 30/70.
- Confirmação da força da tendência: Introduz o indicador ADX para avaliar a força da tendência, confirmando uma tendência forte quando ADX > 25.
- Avaliação da faixa de volatilidade: Utiliza as Bandas de Bollinger para delimitar a faixa de flutuação dos preços, gerando sinais de negociação com base na interação do preço com as bandas.
- Validação do volume: Utiliza um filtro de média móvel dinâmica do volume para garantir que as negociações ocorram com atividade de mercado suficiente.
- Controle de risco: Estratégia de stop loss dinâmico baseada no ATR, com distância de stop loss de 1,5 vezes o ATR.
Vantagens da Estratégia
- Validação de sinais multidimensionais, reduzindo efetivamente sinais falsos.
- O mecanismo dinâmico de stop loss aumenta a capacidade de ajuste de risco da estratégia.
- A combinação de análise de volume e força da tendência aumenta a confiabilidade das negociações.
- Parâmetros ajustáveis dos indicadores, proporcionando boa adaptabilidade.
- Mecanismos completos de entrada e saída, lógica de negociação clara.
- Utiliza indicadores técnicos padrão, fáceis de entender e manter.
Riscos da Estratégia
- Múltiplos indicadores podem causar atraso nos sinais.
- A otimização de parâmetros pode apresentar risco de overfitting.
- Em mercados laterais, pode gerar negociações frequentes.
- Sistemas complexos de sinais podem aumentar a carga computacional.
- Requer uma amostra grande para validar a eficácia da estratégia.
Direções de Otimização
- Introduzir um mecanismo adaptativo de volatilidade do mercado, ajustando dinamicamente os parâmetros dos indicadores.
- Adicionar um filtro de tempo para evitar negociações em períodos desfavoráveis.
- Otimizar a estratégia de take profit, considerando o uso de stop loss móvel.
- Incluir considerações de custos de negociação, otimizando as condições de abertura e fechamento de posições.
- Introduzir um mecanismo de gerenciamento de posição, permitindo ajuste dinâmico do tamanho da posição.
Resumo
A estratégia constrói um sistema de negociação relativamente completo através da coordenação de múltiplos indicadores. Seu principal ponto forte reside no mecanismo de confirmação de sinais multidimensionais e no sistema dinâmico de controle de risco, mas também requer atenção aos problemas de otimização de parâmetros e adaptabilidade ao mercado. Através de otimização e ajustes contínuos, esta estratégia tem potencial para manter um desempenho estável em diferentes condições de mercado.
- 1