Estratégia de momentum EMA-RSI multiestado adaptável combinada com sistema de filtragem de índice de volatilidade

Visão geral
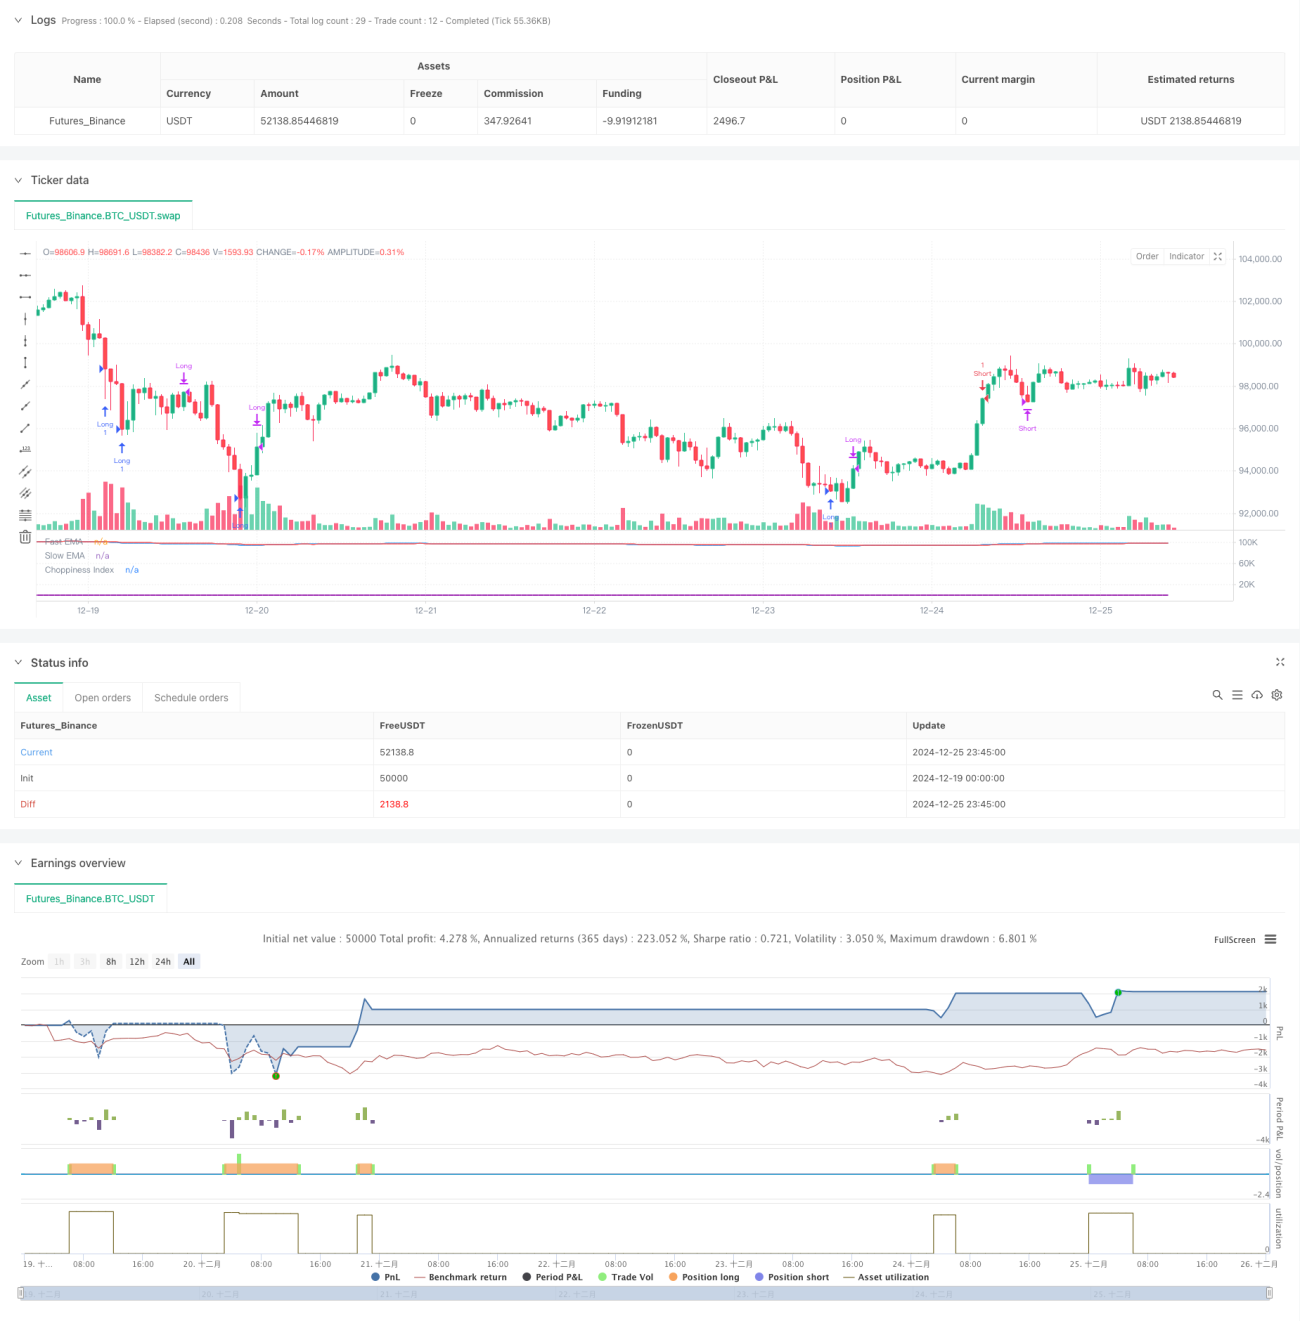
A estratégia é um sistema de auto-adaptação que combina o acompanhamento de tendências e negociações intercalares para julgar o estado do mercado por meio do índice de volatilidade (CI) e adotar a lógica de negociação correspondente de acordo com diferentes condições de mercado. Em mercados de tendências, a estratégia usa sinais de venda e venda de EMA e RSI; em mercados intercalares, a estratégia é baseada principalmente no máximo valor do indicador RSI. A estratégia também inclui um mecanismo de parada de perda para controlar o risco e bloquear os lucros.
Princípio da estratégia
O núcleo da estratégia é dividir o mercado em mercados de tendência (IC <38.2) e mercados intercalares (IC >61.8) através do índice de flutuação (IC <38.2) e dos dois estados (IC <61.8): no mercado de tendência, quando a EMA rápida (IC <9 ciclos) atravessa a EMA lenta (IC <21 ciclos) e o RSI está abaixo de 70, abrem o gancho; quando a EMA lenta atravessa a EMA rápida e o RSI está acima de 30, abrem o gancho. No mercado intercalar, abrem o gancho quando o RSI está abaixo de 30, abrem o gancho quando estão acima de 70.
Vantagens estratégicas
- Adaptabilidade do mercado: Identificar o estado do mercado através de indicadores de CI, com a capacidade de alternar estratégias de negociação com flexibilidade em diferentes ambientes de mercado
- Confirmação de múltiplos sinais: combinação de médias móveis, indicadores de massa e índices de flutuação para aumentar a confiabilidade dos sinais de negociação
- Gerenciamento de risco perfeito: contém mecanismos de suspensão de prejuízos para controlar os riscos de forma eficaz
- Lógicas de negociação claras: distingue tendências e intervalos de dois estados de mercado, regras de negociação claras
- Maior taxa de sucesso: 70 a 80% de sucesso no intervalo de 15 minutos
Risco estratégico
- Sensibilidade de parâmetros: a estratégia usa vários indicadores técnicos e a otimização de configurações de parâmetros é mais complexa
- Risco de Falsa Breakout: Pode produzir sinais errados na transição do estado do mercado
- Efeitos de deslizamento: pode haver um maior risco de deslizamento em um ambiente de mercado com pouca liquidez
- Transações excessivas: mudanças frequentes de estado do mercado podem levar a transações excessivas
- Dependência do mercado: a performance da estratégia pode ser mais influenciada por determinadas condições de mercado
Direção de otimização da estratégia
- Optimização de parâmetros dinâmicos: os parâmetros do indicador podem ser ajustados de acordo com a dinâmica de diferentes ambientes de mercado
- Aumentar o filtro: adicionar condições de filtragem, como volume de transação, taxa de flutuação, para melhorar a qualidade do sinal
- Mecanismos para otimizar o stop loss: pode-se considerar o uso de stop loss dinâmico, como stop loss ATR ou stop loss tracking
- Melhoria da identificação de estados: refinamento da divisão de estados de mercado, adição de lógica de processamento de mercados neutros
- Desenvolvimento de sistemas de confirmação de sinais: adicionar mais mecanismos de confirmação de sinais e reduzir sinais falsos
Resumir
A estratégia, através da combinação de vários indicadores técnicos, constrói um sistema de negociação auto-adaptável, capaz de manter um desempenho estável em diferentes ambientes de mercado. A principal vantagem da estratégia reside na sua adaptabilidade ao mercado e no seu mecanismo de gestão de risco perfeito, mas também precisa prestar atenção a questões como a otimização de parâmetros e a dependência das condições de mercado.
- 1