Visão geral
A estratégia é um sistema de negociação de reversão de tendência que combina a média móvel do índice (EMA) e o indicador relativamente fraco (RSI). Com a confirmação de ruptura do indicador RSI no nível de 50 através de sinais cruzados de 9 e 21 EMAs, o sistema fornece aos comerciantes um ponto de reversão de tendência preciso. O sistema é projetado com um mecanismo de controle de risco completo, incluindo uma taxa de stop loss fixa, que controla efetivamente a reversão.
Princípio da estratégia
A lógica central da estratégia baseia-se no cruzamento entre a EMA rápida (ciclo 9) e a EMA lenta (ciclo 21) e usa o indicador RSI para confirmar a dinâmica. Quando a EMA rápida atravessa a EMA lenta para cima e o RSI é maior que 50, o sistema emite um sinal múltiplo; quando a EMA rápida atravessa a EMA lenta para baixo e o RSI é menor que 50, o sistema emite um sinal de equilíbrio.
Vantagens estratégicas
- Mecanismo de dupla confirmação: Combinação de confirmação de EMA e RSI, reduzindo significativamente a probabilidade de falsos sinais
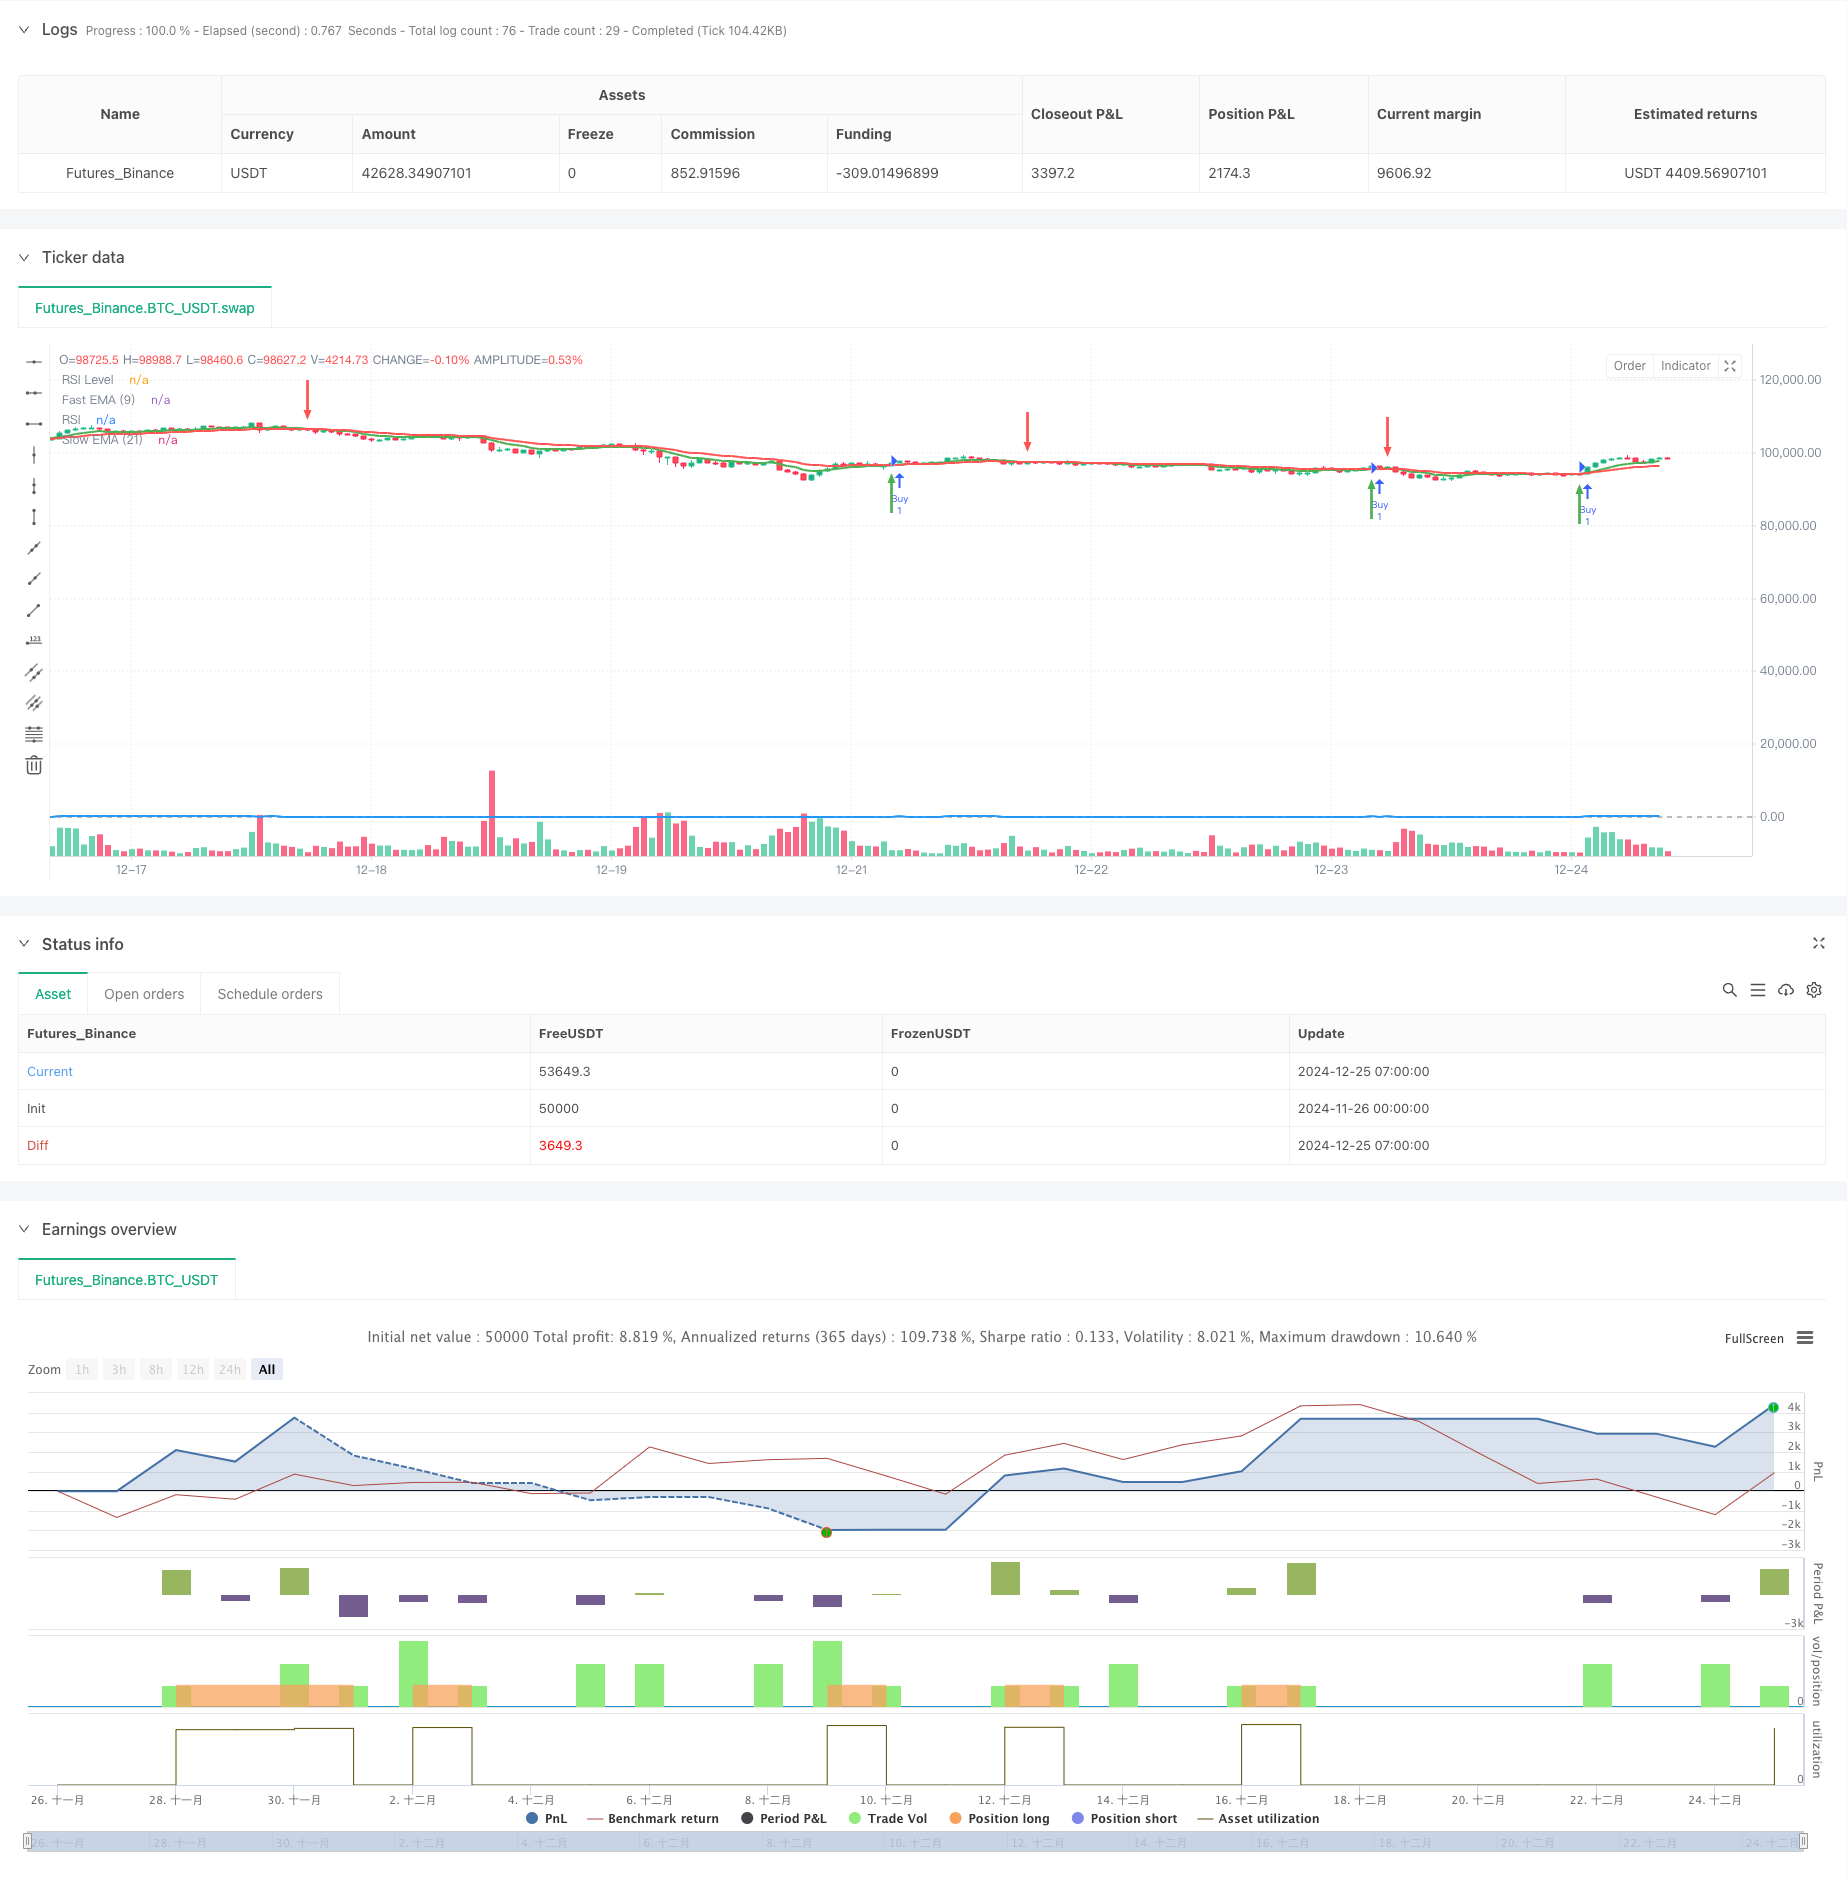
- Visualização clara: usando setas verdes e vermelhas para marcar os pontos de compra e venda, os sinais de negociação são intuitivamente claros
- Gerenciamento de risco perfeito: função de parada de parada de perda embutida, com flexibilidade de ajuste da taxa de risco-benefício de acordo com a volatilidade do mercado
- Adaptabilidade: os parâmetros centrais podem ser ajustados para se adaptar a diferentes ambientes de mercado e variedades de negociação
- Simplicidade de execução: regras de negociação claras e adequadas para a implementação de sistemas de negociação automatizados
Risco estratégico
- Mercado horizontal fraco: Falso sinal pode ocorrer com frequência em situações de turbulência intermitente
- Risco de atraso: a média móvel tem um certo atraso e pode perder o melhor momento de entrada
- Falso julgamento do RSI: em situações extremas, o RSI pode produzir sinais enganosos
- Sensibilidade de parâmetros: Diferentes cenários de mercado podem exigir ajustes de parâmetros, aumentando os custos de manutenção da estratégia Solução: Recomenda-se o uso em ambientes de mercado com tendências claras, filtrando a flutuabilidade com o acréscimo do indicador ATR e combinando com tendências de períodos mais longos.
Direção de otimização da estratégia
- Introdução de filtros de volatilidade: recomenda-se a adição de indicadores ATR para parar de negociar em ambientes de baixa volatilidade
- Optimizar o stop loss: pode ser considerado o uso de stop loss dinâmico, como o stop loss de rastreamento ou a configuração de stop loss baseada no ATR
- Aumento do filtro de intensidade da tendência: pode ser introduzido um indicador de tendência de um período mais longo, apenas para negociar na direção da tendência principal
- Melhorar a confirmação de volume de transações: recomenda-se a adição de análise de volume de transações para melhorar a confiabilidade do sinal
- Classificação do cenário de mercado: parâmetros podem ser ajustados de acordo com a dinâmica de diferentes cenários de mercado, aumentando a adaptabilidade da estratégia
Resumir
A estratégia, combinada com a confirmação de EMA cruzada e RSI, constrói um robusto sistema de acompanhamento de tendências. Um mecanismo de controle de risco completo e uma interface visível e clara tornam-na muito prática.
/*backtest
start: 2024-11-26 00:00:00
end: 2024-12-25 08:00:00
period: 1h
basePeriod: 1h
exchanges: [{"eid":"Futures_Binance","currency":"BTC_USDT"}]
*/

//@version=5
strategy("EMA Crossover with RSI Confirmation and Buy/Sell Signals", overlay=true)

// Input for EMAs and RSI
fastLength = input.int(9, title="Fast EMA Length")
slowLength = input.int(21, title="Slow EMA Length")
rsiLength = input.int(14, title="RSI Length")
rsiLevel = input.int(50, title="RSI Level", minval=0, maxval=100)

// Calculate the EMAs and RSI
fastEMA = ta.ema(close, fastLength)
slowEMA = ta.ema(close, slowLength)
rsi = ta.rsi(close, rsiLength)

// Plot the EMAs on the chart
plot(fastEMA, color=color.green, linewidth=2, title="Fast EMA (9)")
plot(slowEMA, color=color.red, linewidth=2, title="Slow EMA (21)")

// Plot the RSI on a separate pane (below the chart)
hline(rsiLevel, "RSI Level", color=color.gray)
plot(rsi, color=color.blue, linewidth=2, title="RSI")

// Buy condition: Fast EMA crosses above Slow EMA and RSI crosses above 50
buyCondition = ta.crossover(fastEMA, slowEMA) and rsi > rsiLevel

// Sell condition: Fast EMA crosses below Slow EMA and RSI crosses below 50
sellCondition = ta.crossunder(fastEMA, slowEMA) and rsi < rsiLevel

// Execute trades based on conditions
if (buyCondition)
    strategy.entry("Buy", strategy.long)
    label.new(bar_index, low, "Buy", color=color.green, textcolor=color.white, style=label.style_label_up, size=size.small)

if (sellCondition)
    strategy.close("Buy")
    label.new(bar_index, high, "Sell", color=color.red, textcolor=color.white, style=label.style_label_down, size=size.small)

// Strategy exit (optional): Fixed risk-to-reward ratio (take profit and stop loss)
takeProfit = input.int(2, title="Take Profit (Risk-Reward)", minval=1)
stopLoss = input.int(1, title="Stop Loss (Risk-Reward)", minval=1)

strategy.exit("Exit Buy", "Buy", stop=close * (1 - stopLoss / 100), limit=close * (1 + takeProfit / 100))

// Plot buy/sell arrows for visualization
plotarrow(buyCondition ? 1 : na, offset=-1, colorup=color.green, maxheight=30, title="Buy Signal Arrow")
plotarrow(sellCondition ? -1 : na, offset=-1, colordown=color.red, maxheight=30, title="Sell Signal Arrow")