
Visão geral
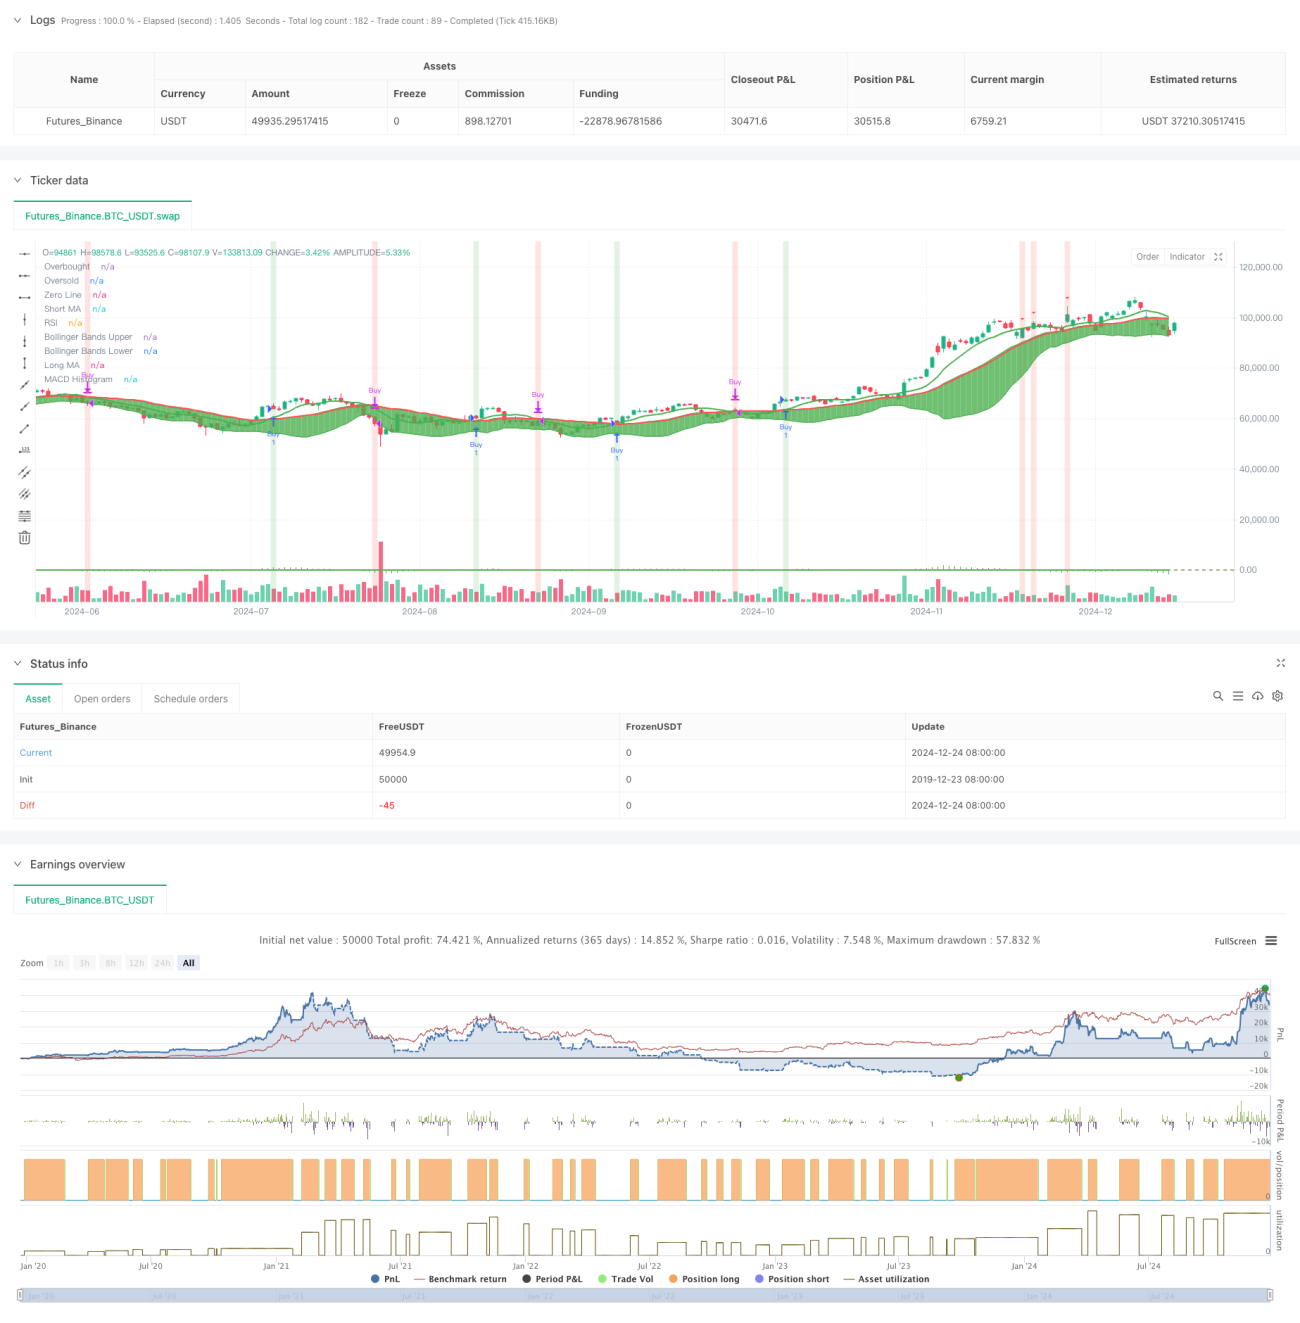
A estratégia é um sistema de negociação abrangente que combina vários indicadores técnicos clássicos, incluindo média móvel (MA), índice de força relativa (RSI), convergência e divergência de média móvel (MACD) e Bandas de Bollinger (BB). O sistema usa a cooperação coordenada desses indicadores para encontrar sinais de compra e venda mais precisos no mercado, melhorando assim a taxa de sucesso das transações.
Princípio da estratégia
A estratégia adota um mecanismo de verificação de sinal multicamadas, que inclui principalmente os seguintes aspectos:
- Determine a direção da tendência subjacente usando o cruzamento das médias móveis de curto prazo (9 dias) e de longo prazo (21 dias)
- Use o RSI (14 dias) para identificar áreas de sobrecompra e sobrevenda, definindo 70 e 30 como níveis-chave
- Use MACD (12, 26, 9) para confirmar a força da tendência e possíveis pontos de inflexão
- Use Bandas de Bollinger (20 dias, 2 desvios padrão) para determinar o intervalo de flutuações de preços e potenciais pontos de reversão
O sistema gera sinais de negociação nas seguintes condições:
- Sinal de compra importante: MA de curto prazo cruza acima de MA de longo prazo
- Sinal de venda importante: MA de curto prazo cruza abaixo da MA de longo prazo
- Sinais auxiliares de compra: RSI está abaixo de 30 e o histograma MACD é positivo e o preço toca a Banda de Bollinger inferior
- Sinais auxiliares de venda: RSI está acima de 70 e o histograma MACD é negativo e o preço toca a Banda de Bollinger superior
Vantagens estratégicas
- Análise multidimensional: Ao integrar vários indicadores técnicos, é fornecida uma perspectiva de análise de mercado mais abrangente
- Mecanismo de confirmação de sinal: a combinação de sinais principais e auxiliares pode reduzir o impacto de sinais falsos
- Controle de risco perfeito: use a combinação de Bandas de Bollinger e RSI para controlar o risco de pontos de entrada
- Capacidade de rastreamento de tendências: por meio da cooperação de MA e MACD, podemos não apenas compreender a tendência principal, mas também identificar o ponto de virada da tendência
- Forte efeito de visualização: O sistema fornece uma interface gráfica clara, incluindo prompts de cores de fundo e marcadores de forma
Risco estratégico
- Histerese do sinal: a própria média móvel tem histerese, o que pode levar a um ponto de entrada abaixo do ideal
- Risco de mercado volátil: Sinais falsos frequentes podem ocorrer em um mercado lateral e volátil
- Indicadores conflitantes: Vários indicadores podem produzir sinais conflitantes em determinados momentos
- Sensibilidade dos parâmetros: O efeito da estratégia é sensível à configuração dos parâmetros e requer otimização suficiente dos parâmetros.
Direção de otimização da estratégia
- Ajuste dinâmico de parâmetros: Os parâmetros de cada indicador podem ser ajustados automaticamente de acordo com a volatilidade do mercado
- Classificação do ambiente de mercado: adicione um mecanismo de reconhecimento para diferentes ambientes de mercado e use diferentes combinações de sinais em diferentes condições de mercado
- Mecanismo de stop loss aprimorado: adicione esquemas de stop loss mais flexíveis, como trailing stop loss ou stop loss baseado em ATR
- Otimização do gerenciamento de posição: ajuste dinamicamente o tamanho da posição com base na força do sinal e na volatilidade do mercado
- Coordenação de período de tempo: considere adicionar análise de vários períodos de tempo para melhorar a confiabilidade do sinal
Resumir
Este é um sistema de estratégia de negociação multidimensional bem projetado que fornece sinais de negociação por meio da sinergia de vários indicadores técnicos. As principais vantagens da estratégia estão em sua estrutura analítica abrangente e rigoroso mecanismo de confirmação de sinal, mas também é necessário prestar atenção a questões como otimização de parâmetros e adaptabilidade ao ambiente de mercado. Seguindo as orientações de otimização recomendadas, essa estratégia ainda tem muito espaço para melhorias.
- 1