
Visão geral
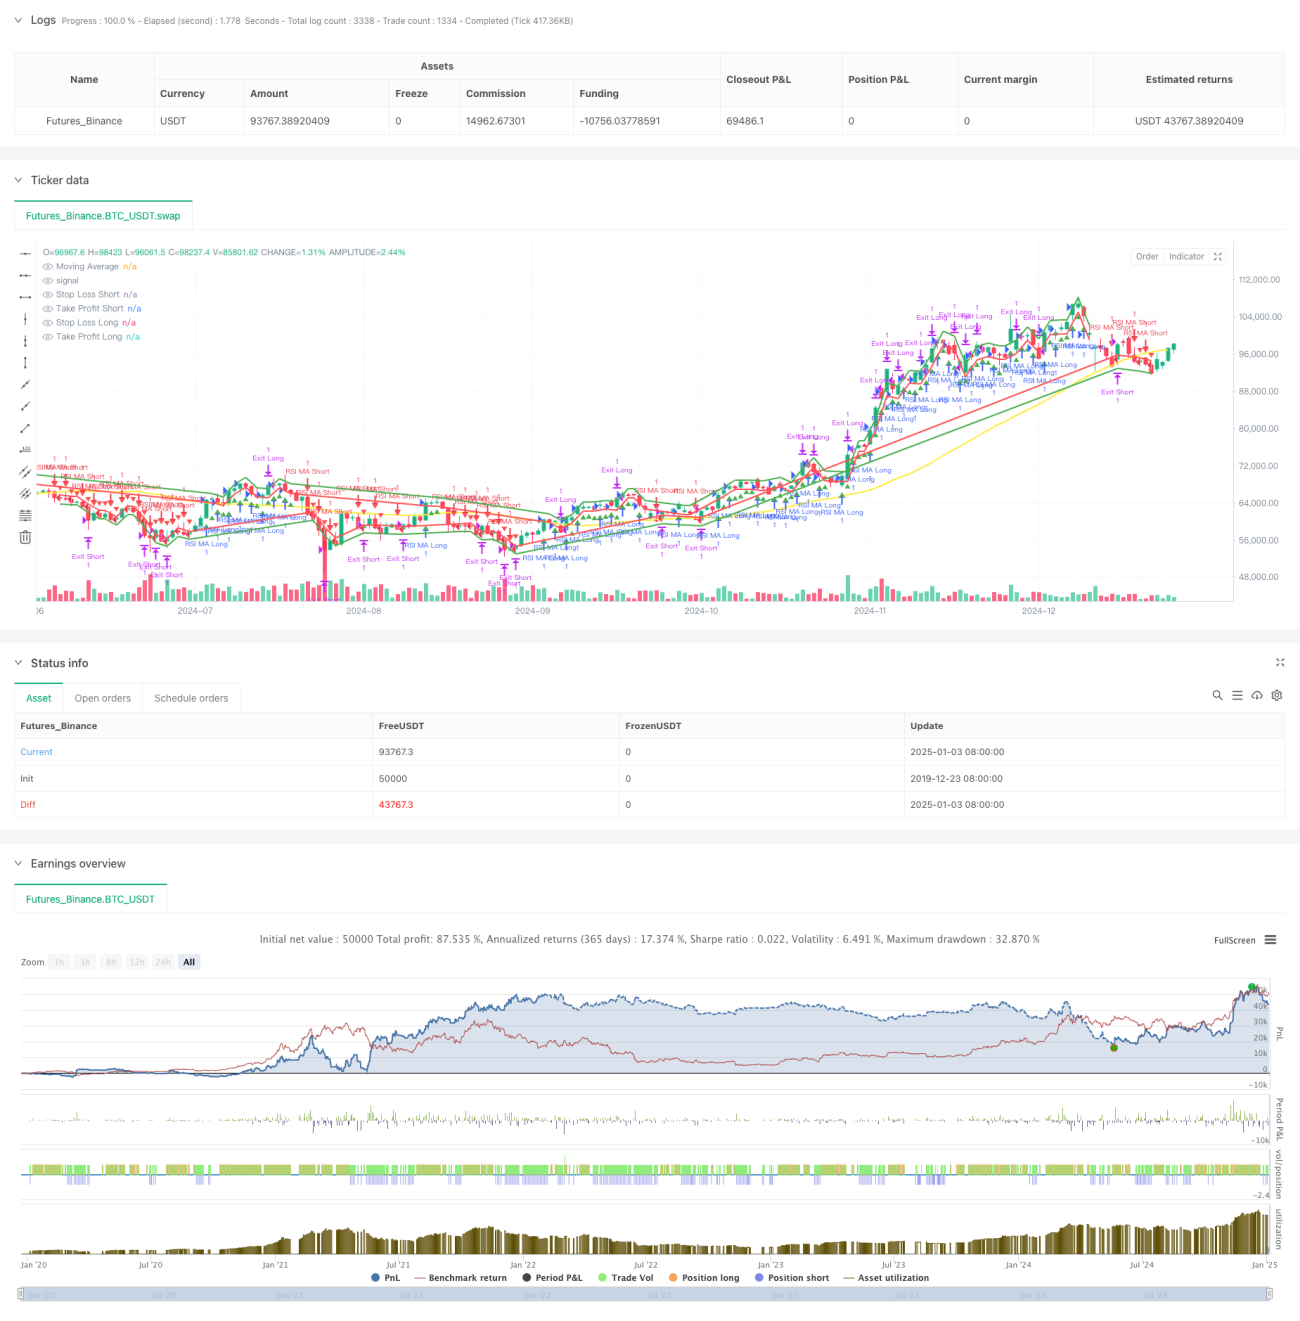
Esta estratégia é um sistema de negociação de acompanhamento de tendências que combina o Índice de Força Relativa (RSI) e a Média Móvel Simples (SMA). Essa estratégia usa a média móvel para determinar a direção da tendência do mercado e usa o indicador RSI para confirmar o momentum, de modo a negociar quando a tendência e o momentum ressoam. A estratégia projetou um mecanismo completo de stop-profit e stop-loss, que pode controlar riscos de forma eficaz.
Princípio da estratégia
A lógica central da estratégia baseia-se na utilização combinada de dois indicadores técnicos:
- Média Móvel (MM): Usada para determinar a tendência geral. Quando o preço está acima da MM, é considerada uma tendência de alta, caso contrário, é uma tendência de baixa.
- Índice de Força Relativa (RSI): Usado para confirmar o momentum do preço. Quando o RSI está acima do limite definido (como 55), ele confirma o momentum de alta, e quando está abaixo do limite (como 45), ele confirma o momentum de baixa.
Lógica de geração de sinal de negociação:
- Condições longas: o preço está acima da MA e o RSI é maior que o limite de compra
- Condições de venda a descoberto: o preço está abaixo da MA e o RSI está abaixo do limite de venda
O controle de risco utiliza métodos de stop loss e take profit percentuais, que são definidos como porcentagens fixas do preço de entrada, respectivamente.
Vantagens estratégicas
- Estabilidade do sinal: Ao combinar a confirmação dupla de tendência e momentum, sinais falsos podem ser efetivamente reduzidos.
- Gerenciamento de risco perfeito: stop loss e take profit de porcentagem fixa são definidos para controlar efetivamente o risco de cada transação.
- Flexibilidade de parâmetros: Parâmetros-chave como período de MA, limite de RSI, etc. podem ser otimizados de acordo com diferentes características de mercado.
- A lógica da estratégia é clara: as regras de negociação são simples e intuitivas, fáceis de entender e executar.
- Forte adaptabilidade: pode ser aplicado a transações em vários períodos de tempo.
Risco estratégico
- Risco de reversão de tendência: Stop Loss contínuos podem ocorrer em pontos de virada de tendência.
- Risco de mercado volátil: negociações frequentes podem levar a perdas em condições de mercado limitadas.
- Dependência de parâmetros: Os parâmetros ideais podem variar muito em diferentes ambientes de mercado.
- Risco de deslizamento: você pode enfrentar grandes deslizamentos quando o mercado flutua violentamente.
- Atraso do indicador técnico: tanto o MA quanto o RSI têm um certo atraso, o que pode levar a um atraso no tempo de entrada.
Direção de otimização da estratégia
- Otimização de parâmetros dinâmicos: introduzir um mecanismo de parâmetros adaptativos para ajustar dinamicamente o período de MA e o limite do RSI de acordo com a volatilidade do mercado.
- Filtragem do ambiente de mercado: adicione um mecanismo de filtragem de volatilidade para ajustar posições ou suspender negociações em um ambiente de alta volatilidade.
- Análise de vários períodos de tempo: introduza confirmação de tendência de longo prazo para melhorar a precisão da direção da negociação.
- Otimização de stop loss: introduza um mecanismo de trailing stop loss para proteger melhor os lucros.
- Filtragem de sinal: adicione indicadores auxiliares, como volume de negociação, para melhorar a confiabilidade do sinal.
Resumir
Esta estratégia combina indicadores de tendência e momentum para construir um sistema de negociação com lógica clara e riscos controláveis. Embora existam alguns riscos inerentes, a estratégia mostra boa praticidade por meio de definição de parâmetros razoáveis e controle de riscos. As direções de otimização subsequentes se concentrarão principalmente no ajuste de parâmetros dinâmicos, na identificação do ambiente de mercado e na melhoria da qualidade do sinal, o que deverá melhorar ainda mais a estabilidade e a lucratividade da estratégia.
- 1