Estratégia inovadora de estrutura inteligente de TIC baseada em combinação de sinais dinâmicos de múltiplos períodos de tempo

RSI MACD EMA BOS FVG HTF LTF ICT
Data de criação: 2025-01-06 14:09:05 última modificação: 2025-01-06 14:09:05
cópia: 0 Cliques: 456
1
focar em
1617
Seguidores

Estratégia inovadora de estrutura inteligente de TIC baseada em combinação de sinais dinâmicos de múltiplos períodos de tempo

Visão geral

A estratégia é um sistema de negociação abrangente que combina vários indicadores técnicos e ICT (Conceito de Negociação Institucional). Ele integra indicadores de análise técnica tradicionais (RSI, indicadores estocásticos, MACD, EMA) e conceitos modernos de negociação de ICT (lacuna de valor justo, ruptura estrutural, análise de viés de alto período de tempo) em diferentes períodos de tempo e filtra por períodos de negociação rigorosos. Obtenha mercado preciso controle de acesso.

Princípio da estratégia

A estratégia opera com base na coordenação de cinco componentes principais:

  1. Análise de viés de alto período de tempo: use a média móvel de 200 dias para determinar a direção da tendência do mercado de um período de tempo maior
  2. Filtro de tempo de negociação: limite a negociação a uma “zona de destruição” específica (07:00-10:00)
  3. Identificação de Lacuna de Valor Justo (FVG): Identificando Lacunas Estruturais no Mercado por meio de Três Padrões K-line
  4. Determinação de Breakout of Structure (BOS): Um breakout com base em um nível de preço chave confirma uma mudança direcional
  5. Confirmação do indicador de baixo período de tempo: verificação múltipla usando RSI, indicador estocástico, MACD e média móvel de 200

Vantagens estratégicas

  1. Integração de sinais multidimensionais: Melhore a confiabilidade do sinal combinando vários indicadores técnicos independentes e conceitos de TIC
  2. Coordenação do ciclo de tempo: A coordenação dos ciclos de tempo alto e baixo melhora a estabilidade do sinal
  3. Captura de oportunidade estrutural: foco em oportunidades de negociação estrutural de alta probabilidade por meio da identificação de FVG e BOS
  4. Controle de risco perfeito: incluindo mecanismo de stop loss e stop profit, gestão de fundos padronizada
  5. Otimização do tempo de negociação: reduza a interferência durante horários de não negociação por meio da filtragem de tempo

Risco estratégico

  1. Atraso do sinal: A combinação de vários indicadores pode levar a um atraso no tempo de entrada
  2. Desempenho instável do mercado: sinais falsos frequentes podem ocorrer em um mercado lateral
  3. Sensibilidade dos parâmetros: A configuração de vários parâmetros indicadores requer verificação suficiente de dados históricos
  4. Risco de execução: combinação complexa de condições pode levar à perda de algumas oportunidades de negociação em negociações reais
  5. Dependência do ambiente de mercado: O desempenho das estratégias em diferentes ambientes de mercado pode variar muito

Direção de otimização da estratégia

  1. Ajuste dinâmico de parâmetros: ajuste adaptativo dos parâmetros de cada indicador de acordo com a volatilidade do mercado
  2. Classificação do ambiente de mercado: adicione o módulo de identificação do ambiente de mercado e use diferentes combinações de parâmetros para diferentes condições de mercado
  3. Otimização do peso do sinal: introduzir métodos de aprendizado de máquina para otimizar a distribuição de peso de vários indicadores
  4. Expansão do período de tempo: adicione mais períodos de tempo para análise e melhore a confiabilidade do sinal
  5. Melhor controlo de risco: introdução de um mecanismo dinâmico de stop-loss e otimização de estratégias de gestão de fundos

Resumir

Esta estratégia cria um sistema de negociação abrangente integrando análise técnica tradicional com conceitos modernos de TIC. Suas vantagens estão na confirmação de sinal multidimensional e no controle rigoroso de risco, mas também enfrenta desafios na otimização de parâmetros e na adaptabilidade do mercado. Por meio de otimização e melhoria contínuas, espera-se que a estratégia mantenha um desempenho estável em diferentes ambientes de mercado.
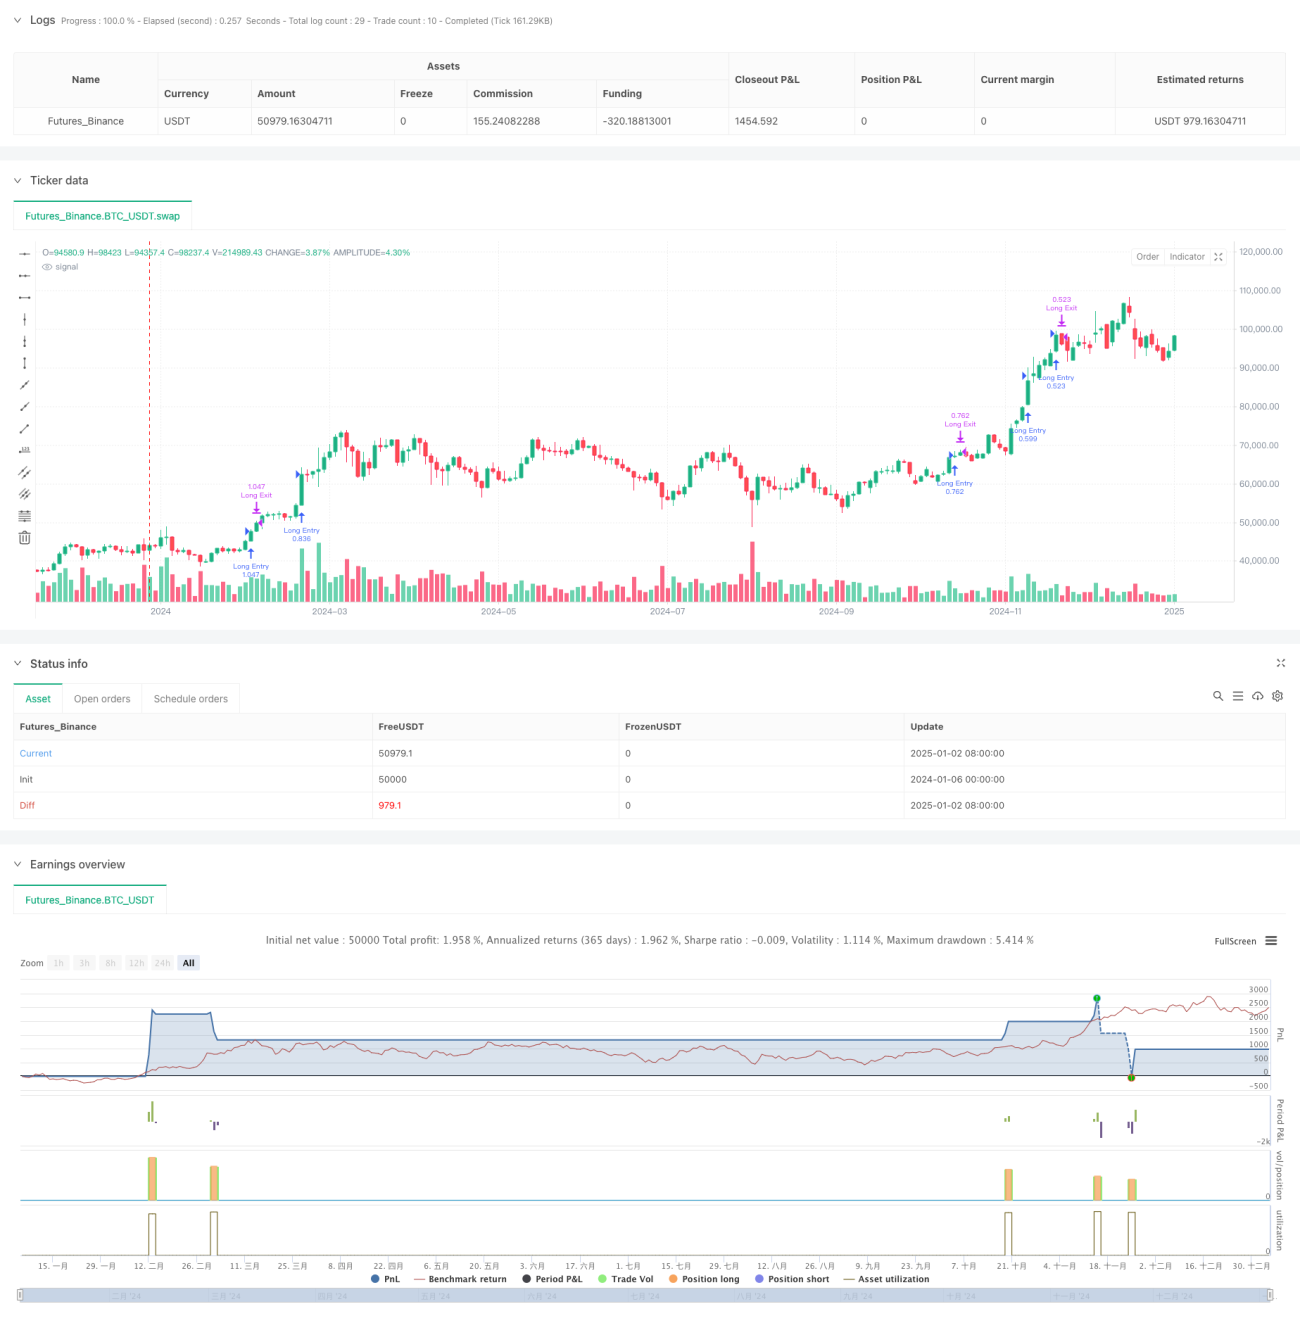
Código-fonte da estratégia
/*backtest
start: 2024-01-06 00:00:00
end: 2025-01-04 08:00:00
period: 2d
basePeriod: 2d
exchanges: [{"eid":"Futures_Binance","currency":"BTC_USDT"}]
*/

// -----------------------------------------------------
// Multi-Signal Conservative Strategy (Pine Script v5)
// + More ICT Concepts (HTF Bias, FVG, Killzone, BOS)
// -----------------------------------------------------
//
// Combines:
// - RSI, Stochastic, MACD, 200 EMA (lower TF)
// - Higher Timeframe (HTF) bias check via 200 EMA
// - Kill Zone time filter
// - Fair Value Gap (FVG) detection (simplified 3-candle approach)
// - Break of Structure (BOS) using pivot highs/lows
// - Only trade markers on chart (no extra indicator plots).
//
// Use on lower timeframes: 1m to 15m
// Always backtest thoroughly and manage risk properly.
//
// -----------------------------------------------------
//@version=5
strategy(title="Multi-Signal + ICT Concepts (HTF/FVG/Killzone/BOS)", shorttitle="ICTStrategyExample",overlay=true, pyramiding=0, initial_capital=10000, default_qty_type=strategy.percent_of_equity, default_qty_value=100)

// -----------------------------------------------------
// User Inputs
// -----------------------------------------------------
/////////////// Lower TF Inputs ///////////////
emaLength       = input.int(200,   "LTF EMA Length",           group="Lower TF")
rsiLength       = input.int(14,    "RSI Length",               group="Lower TF")
rsiUpper        = input.int(60,    "RSI Overbought Thresh",    group="Lower TF", minval=50, maxval=80)
rsiLower        = input.int(40,    "RSI Oversold Thresh",      group="Lower TF", minval=20, maxval=50)
stochLengthK    = input.int(14,    "Stoch K Length",           group="Lower TF")
stochLengthD    = input.int(3,     "Stoch D Smoothing",        group="Lower TF")
stochSmooth     = input.int(3,     "Stoch Smoothing",          group="Lower TF")
macdFast        = input.int(12,    "MACD Fast Length",         group="Lower TF")
macdSlow        = input.int(26,    "MACD Slow Length",         group="Lower TF")
macdSignal      = input.int(9,     "MACD Signal Length",       group="Lower TF")

/////////////// ICT Concepts Inputs ///////////////
htfTimeframe    = input.timeframe("60", "HTF for Bias (e.g. 60, 240)", group="ICT Concepts")
htfEmaLen       = input.int(200,  "HTF EMA Length",                   group="ICT Concepts")
sessionInput    = input("0700-1000:1234567", "Kill Zone Window", group="ICT Concepts")
fvgLookbackBars = input.int(2,    "FVG Lookback Bars (3-candle check)",  group="ICT Concepts", minval=1, maxval=10)

/////////////// Risk Management ///////////////
stopLossPerc    = input.float(0.5, "Stop-Loss %",  step=0.1, group="Risk")
takeProfitPerc  = input.float(1.0, "Take-Profit %", step=0.1, group="Risk")

// -----------------------------------------------------
// 1) Higher Timeframe Bias
// -----------------------------------------------------
//
// We'll request the HTF close, then compute the HTF EMA on that data
// to decide if it's bullish or bearish overall.

htfClose       = request.security(syminfo.tickerid, htfTimeframe, close)
htfEma         = request.security(syminfo.tickerid, htfTimeframe, ta.ema(close, htfEmaLen))
isBullHTF      = htfClose > htfEma
isBearHTF      = htfClose < htfEma

// -----------------------------------------------------
// 2) Kill Zone / Session Filter
// -----------------------------------------------------
//
// We'll only consider trades if the current bar is within
// the user-defined session time (e.g., 07:00 to 10:00 local or exchange time).

isInKillZone = time(timeframe.period, sessionInput) != 0

// -----------------------------------------------------
// 3) Fair Value Gap (FVG) Detection (Simplified)
//
// For a "Bullish FVG" among bars [2], [1], [0]:
//     high[2] < low[0] => there's a gap that bar [1] didn't fill
// For a "Bearish FVG":
//     low[2] > high[0] => there's a gap that bar [1] didn't fill
//
// Real ICT usage might check partial fill, candle bodies vs wicks, etc.
// This is just a minimal example for demonstration.

fvgBarsAgo = fvgLookbackBars // default = 2
bullFVG = high[fvgBarsAgo] < low  // e.g. high[2] < low[0]
bearFVG = low[fvgBarsAgo]  > high // e.g. low[2]  > high[0]

// -----------------------------------------------------
// 4) Break of Structure (BOS)
// -----------------------------------------------------
// Using pivot detection from previous example:

swingLen = 2  // pivot detection length (bars on each side)
// Identify a pivot high at bar [1]
swingHigh = high[1] > high[2] and high[1] > high[0]
// Identify a pivot low at bar [1]
swingLow  = low[1]  < low[2]  and low[1]  < low[0]

// Track the most recent pivot high & low
var float lastPivotHigh = na
var float lastPivotLow  = na

if swingHigh
    lastPivotHigh := high[1]

if swingLow
    lastPivotLow := low[1]

bosUp   = not na(lastPivotHigh) and (close > lastPivotHigh)
bosDown = not na(lastPivotLow)  and (close < lastPivotLow)

// -----------------------------------------------------
// 5) Lower TF Indicator Calculations
// -----------------------------------------------------
ema200      = ta.ema(close, emaLength)  // 200 EMA on LTF
rsiValue    = ta.rsi(close, rsiLength)
kValue      = ta.stoch(high, low, close, stochLengthK)
dValue      = ta.sma(kValue, stochLengthD)
stochSignal = ta.sma(dValue, stochSmooth)
[macdLine, signalLine, histLine] = ta.macd(close, macdFast, macdSlow, macdSignal)

// LTF trend filter
isBullTrend = close > ema200
isBearTrend = close < ema200

// -----------------------------------------------------
// Combine All Conditions
// -----------------------------------------------------
//
// We'll require that all filters line up for a long or short:
//  - HTF bias
//  - kill zone
//  - bullish/bearish FVG
//  - BOS up/down
//  - RSI, Stoch, MACD alignment
//  - Price above/below LTF 200 EMA

longCondition = isInKillZone                     // must be in session
 and isBullHTF                                   // HTF bias bullish
 and bullFVG                                     // bullish FVG
 and bosUp                                       // BOS up
 and (rsiValue > rsiUpper)                       // RSI > threshold
 and (kValue > dValue)                           // stoch K above D
 and (macdLine > signalLine)                     // MACD bullish
 and isBullTrend                                 // above LTF 200 EMA

shortCondition = isInKillZone                    // must be in session
 and isBearHTF                                   // HTF bias bearish
 and bearFVG                                     // bearish FVG
 and bosDown                                     // BOS down
 and (rsiValue < rsiLower)                       // RSI < threshold
 and (kValue < dValue)                           // stoch K below D
 and (macdLine < signalLine)                     // MACD bearish
 and isBearTrend                                 // below LTF 200 EMA

// -----------------------------------------------------
// Strategy Entries
// -----------------------------------------------------
if longCondition
    strategy.entry("Long Entry", strategy.long)

if shortCondition
    strategy.entry("Short Entry", strategy.short)

// -----------------------------------------------------
// Risk Management (Stop-Loss & Take-Profit)
// -----------------------------------------------------
if strategy.position_size > 0
    // Long position exit
    strategy.exit("Long Exit", stop  = strategy.position_avg_price * (1.0 - stopLossPerc/100.0), limit = strategy.position_avg_price * (1.0 + takeProfitPerc/100.0))

if strategy.position_size < 0
    // Short position exit
    strategy.exit("Short Exit",  stop  = strategy.position_avg_price * (1.0 + stopLossPerc/100.0), limit = strategy.position_avg_price * (1.0 - takeProfitPerc/100.0))

// -----------------------------------------------------
// Hide All Indicator Plots
// (We only show trade markers for entry & exit)
// -----------------------------------------------------
// Comment out or remove any plot() calls so chart stays clean.
//
// Example (commented out):
// plot(ema200, title="EMA 200", color=color.new(color.yellow, 0), linewidth=2)
// plot(rsiValue, title="RSI", color=color.new(color.blue, 0))
// plot(macdLine, title="MACD", color=color.new(color.teal, 0))
// plot(signalLine, title="Signal", color=color.new(color.purple, 0))