
Visão geral
Esta estratégia é um sistema de negociação quantitativa baseado em cruzamento de média móvel e indicadores RSI, usado principalmente para negociação no mercado de opções. A estratégia usa os sinais de cruzamento das médias móveis rápidas e lentas, combinados com os níveis de sobrecompra e sobrevenda do RSI para determinar o momento das transações, ao mesmo tempo em que define take-profit e stop-loss para controlar os riscos. Esta estratégia é adequada para negociação em um período de 5 minutos.
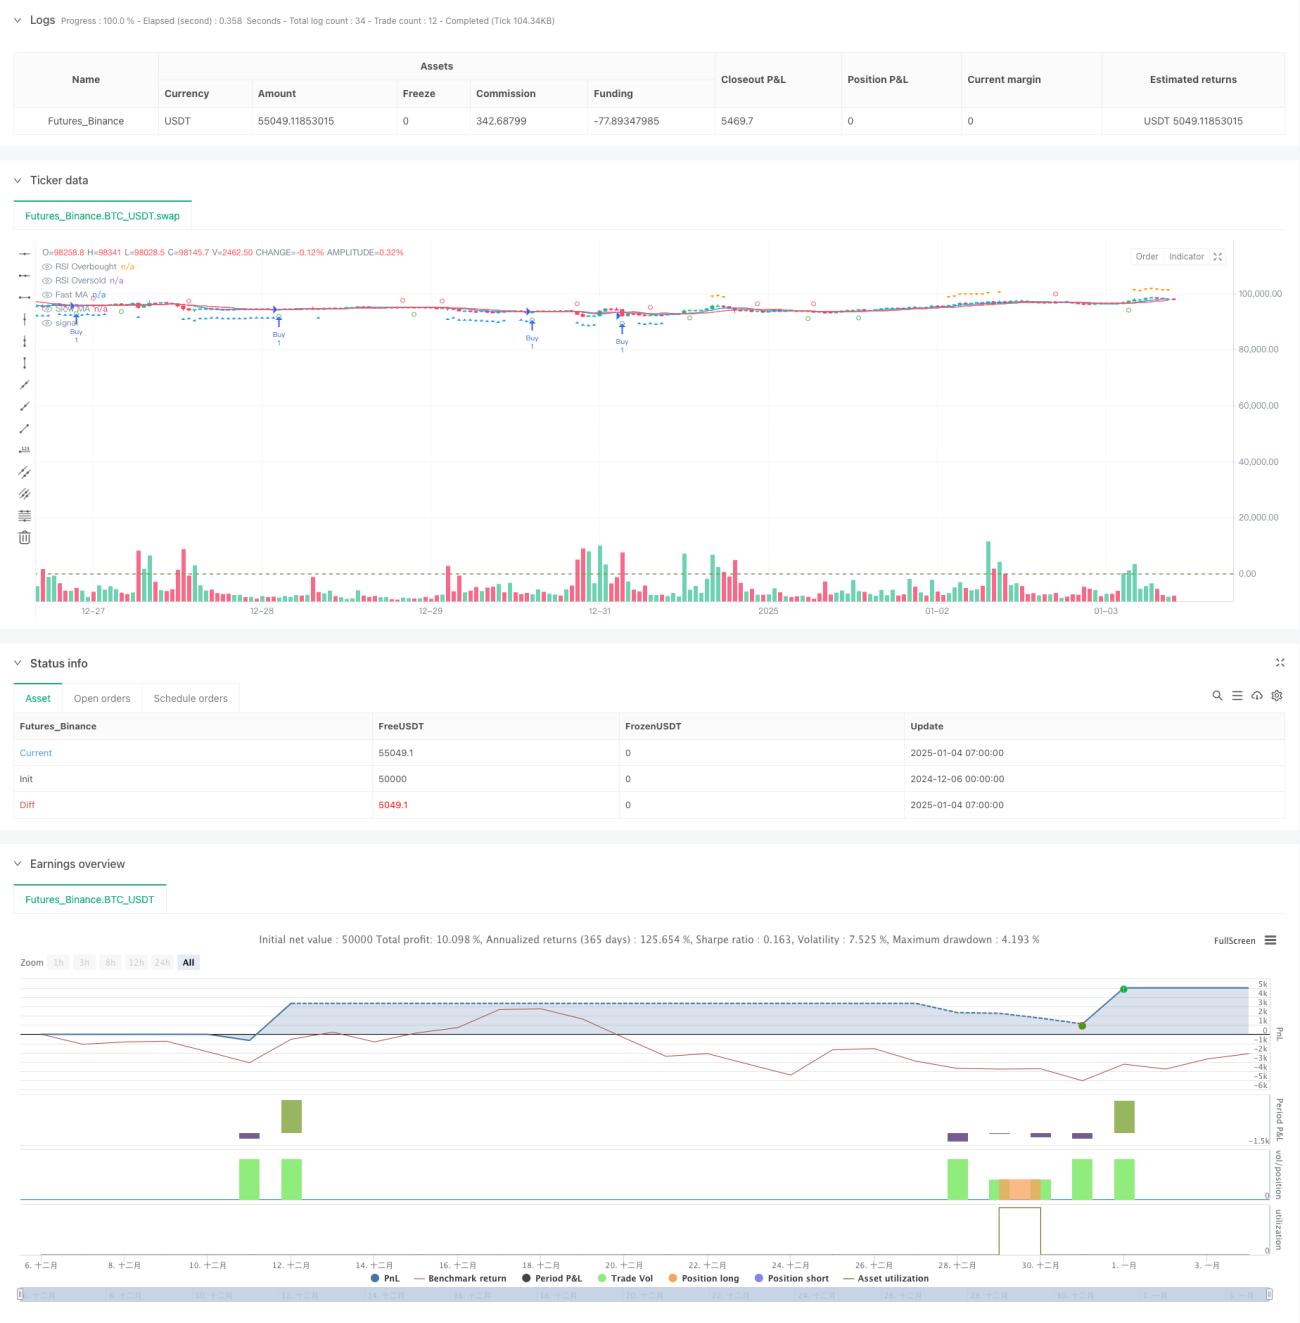
Princípio da estratégia
A estratégia utiliza dois indicadores técnicos principais: Média Móvel (MM) e Índice de Força Relativa (IFR). Especificamente:
- Use médias móveis simples (SMAs) de 7 e 13 períodos para capturar tendências de preços
- Usando o indicador RSI de 17 períodos para identificar condições de sobrecompra e sobrevenda
- Quando a média móvel rápida cruza a média móvel lenta para cima e o RSI está abaixo de 43, o sistema gera um sinal longo
- Quando a média móvel rápida cruza a média móvel lenta para baixo e o RSI está acima de 64, o sistema gera um sinal curto
- Defina um take profit de 4% e um stop loss de 0,5% para gerenciar o risco
Vantagens estratégicas
- Mecanismo de confirmação múltipla: combine o cruzamento da média móvel e os indicadores RSI para fornecer sinais de negociação mais confiáveis
- Gestão de risco perfeita: defina uma porcentagem fixa de stop-profit e stop-loss para controlar riscos de forma eficaz
- Forte adaptabilidade: os parâmetros podem ser ajustados de forma flexível de acordo com diferentes condições de mercado
- Suporte de visualização: a estratégia fornece instruções gráficas claras para ajudar os traders a entender as condições do mercado
- Regras operacionais claras: condições claras de entrada e saída, reduzindo a interferência causada por julgamento subjetivo
Risco estratégico
- Risco de mercado volátil: Sinais falsos frequentes podem ocorrer em um mercado lateral e volátil
- Risco de deslizamento: quando o mercado de opções é ilíquido, você pode enfrentar um grande deslizamento
- Sensibilidade dos parâmetros: O efeito da estratégia é sensível às configurações dos parâmetros e precisa ser continuamente otimizado.
- Dependência do ambiente de mercado: Em um ambiente de mercado volátil, o stop loss pode não ser oportuno o suficiente
- Risco sistêmico: Quando ocorrem lacunas de mercado ou grandes eventos, o stop loss pode falhar
Direção de otimização da estratégia
- Introdução de indicadores de volatilidade: considere incorporar ATR ou Bandas de Bollinger em seu sistema de tomada de decisão
- Otimizar a adaptação dos parâmetros: desenvolver um mecanismo dinâmico de ajuste dos parâmetros com base nas condições de mercado
- Aumente a filtragem do sentimento do mercado: combine o volume de negociação e outros indicadores para filtrar sinais falsos
- Melhorar o mecanismo de stop loss: considerar a introdução de um trailing stop loss para melhorar a eficiência da gestão de risco
- Adicionar filtro de tempo: adicione limite de janela de tempo de negociação para evitar negociações ineficientes
Resumir
Esta estratégia constrói um sistema de negociação relativamente completo combinando o cruzamento da média móvel e os indicadores RSI. As vantagens da estratégia estão na confirmação de múltiplos sinais e no gerenciamento de risco perfeito, mas também é necessário prestar atenção ao impacto do ambiente de mercado no desempenho da estratégia. Por meio de otimização e melhoria contínuas, espera-se que essa estratégia alcance um desempenho estável no mercado de opções. É recomendável que os traders realizem testes retrospectivos e otimização de parâmetros suficientes antes do uso em tempo real.
- 1