Estratégia de negociação de reversão de momentum de indicador técnico duplo combinada com sistema de gerenciamento de risco

Visão geral
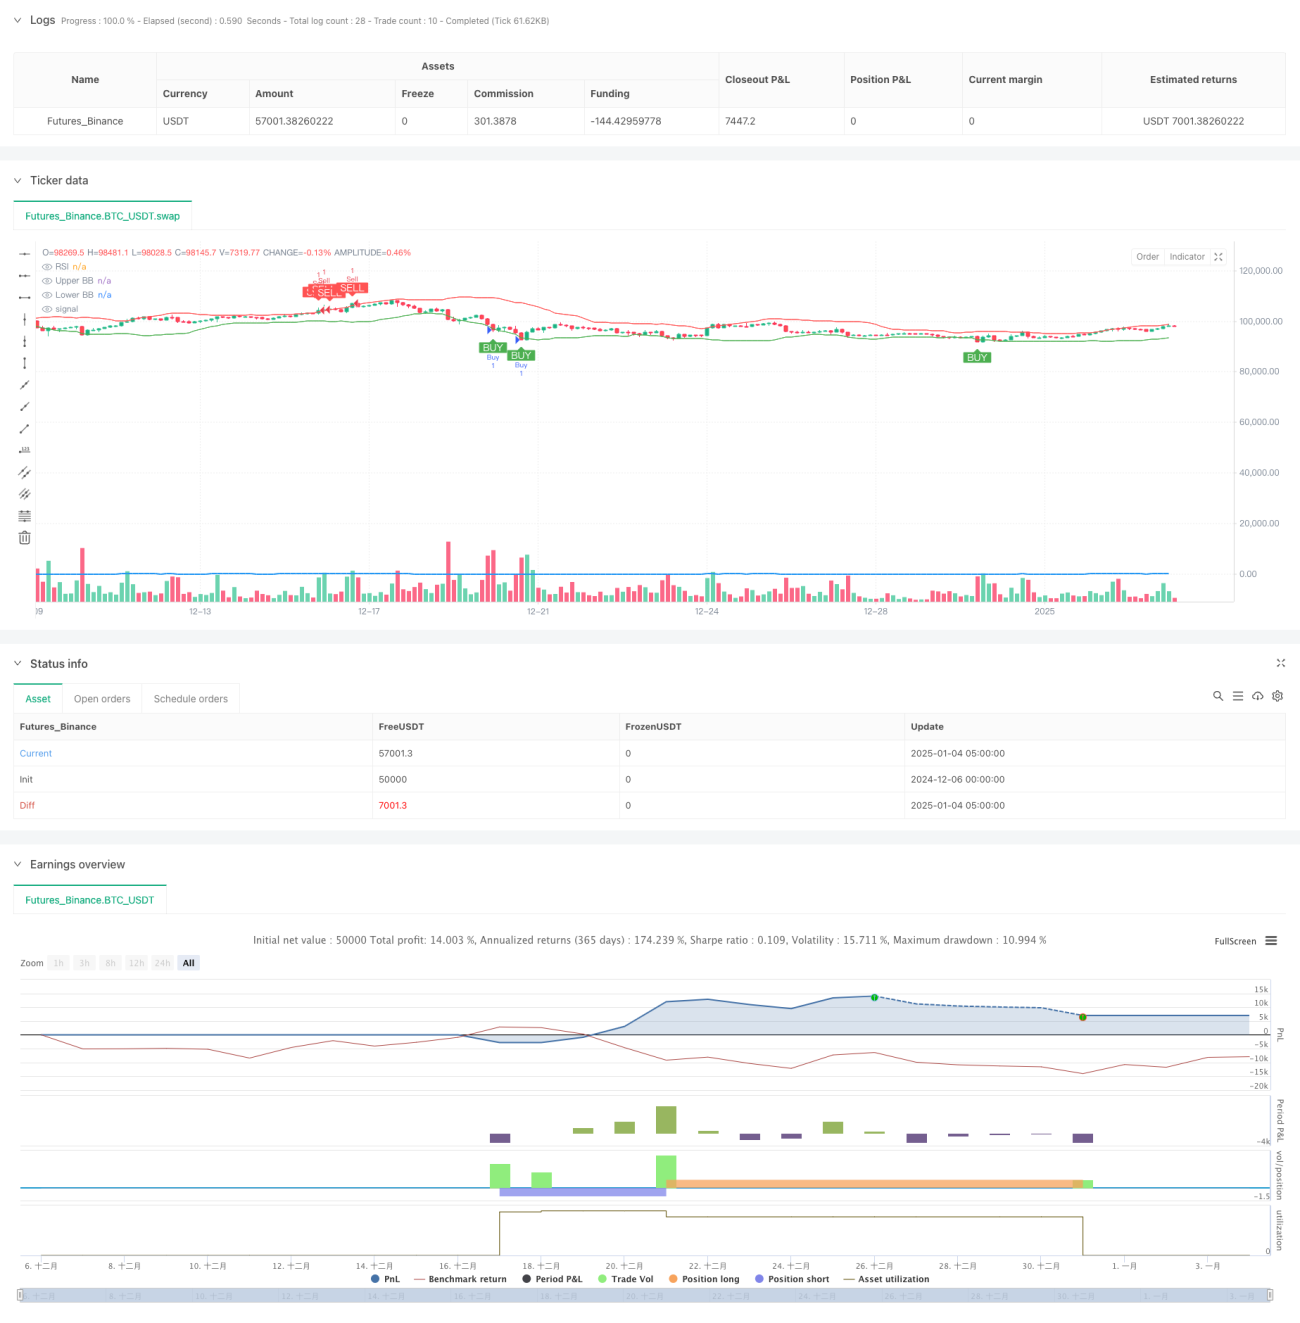
Esta estratégia é um sistema de negociação de reversão de momentum que combina os indicadores técnicos duplos RSI e Bandas de Bollinger para negociar identificando áreas de sobrecompra e sobrevenda. A estratégia usa uma relação risco-retorno de 1:2 e combina um stop loss móvel para controle de risco. A lógica central é negociar quando tanto o RSI quanto as Bandas de Bollinger mostram sinais de sobrecompra ou sobrevenda ao mesmo tempo e proteger os fundos por meio de uma gestão de risco rigorosa.
Princípio da estratégia
A estratégia usa o RSI de 14 períodos e as Bandas de Bollinger de 20 períodos como principais indicadores. As condições de compra devem ser atendidas simultaneamente: o RSI está abaixo de 30 (sobrevenda) e o preço toca ou cai abaixo da Banda de Bollinger inferior. As condições de venda devem ser atendidas ao mesmo tempo: o RSI está acima de 70 (sobrecompra) e o preço toca ou excede a Banda de Bollinger superior. O sistema usa o ponto mais alto/mais baixo de 5 K-lines como stop loss móvel, e a posição take-profit é o dobro da distância do stop loss, implementando estritamente uma relação risco-retorno de 1:2.
Vantagens estratégicas
- A filtragem de índice técnico duplo melhora a qualidade do sinal e reduz sinais falsos
- Combinando indicadores de momentum e volatilidade para fornecer uma perspectiva de mercado mais abrangente
- Mecanismo de controle de risco rigoroso, incluindo trailing stop loss e relação risco-retorno fixa
- O sistema é totalmente automatizado, eliminando a interferência emocional humana
- A lógica da estratégia é clara, fácil de entender e manter
Risco estratégico
- Stop losses podem ser frequentes em mercados de tendências
- Condições duplas podem perder algumas oportunidades de negociação
- Os parâmetros fixos do RSI e da Banda de Bollinger podem não ser adequados para todos os ambientes de mercado
- Trailing stops podem levar a saídas prematuras em mercados voláteis
- É necessária uma gestão razoável do dinheiro para lidar com perdas consecutivas
Direção de otimização da estratégia
- Introduzir um mecanismo de parâmetros adaptativos para ajustar dinamicamente os parâmetros do indicador de acordo com a volatilidade do mercado
- Adicionado filtro de tendência para suspender a negociação de reversão em tendências fortes
- Desenvolver um sistema dinâmico de relação risco-retorno e ajustá-lo de acordo com as condições de mercado
- Adicionar mecanismo de confirmação de volume para melhorar a confiabilidade do sinal
- Implementar mecanismos de stop loss mais flexíveis, como trailing stop loss ou time stop loss
Resumir
Esta é uma estratégia de negociação de reversão bem estruturada que usa indicadores técnicos duplos para maior precisão e emprega uma gestão de risco rigorosa. Embora a estratégia seja simples e intuitiva, ela contém os principais elementos necessários para um sistema de negociação maduro. Por meio das direções de otimização sugeridas, essa estratégia tem espaço para melhorias futuras. Na negociação real, é recomendável realizar primeiro backtesting e otimização de parâmetros suficientes.
- 1