
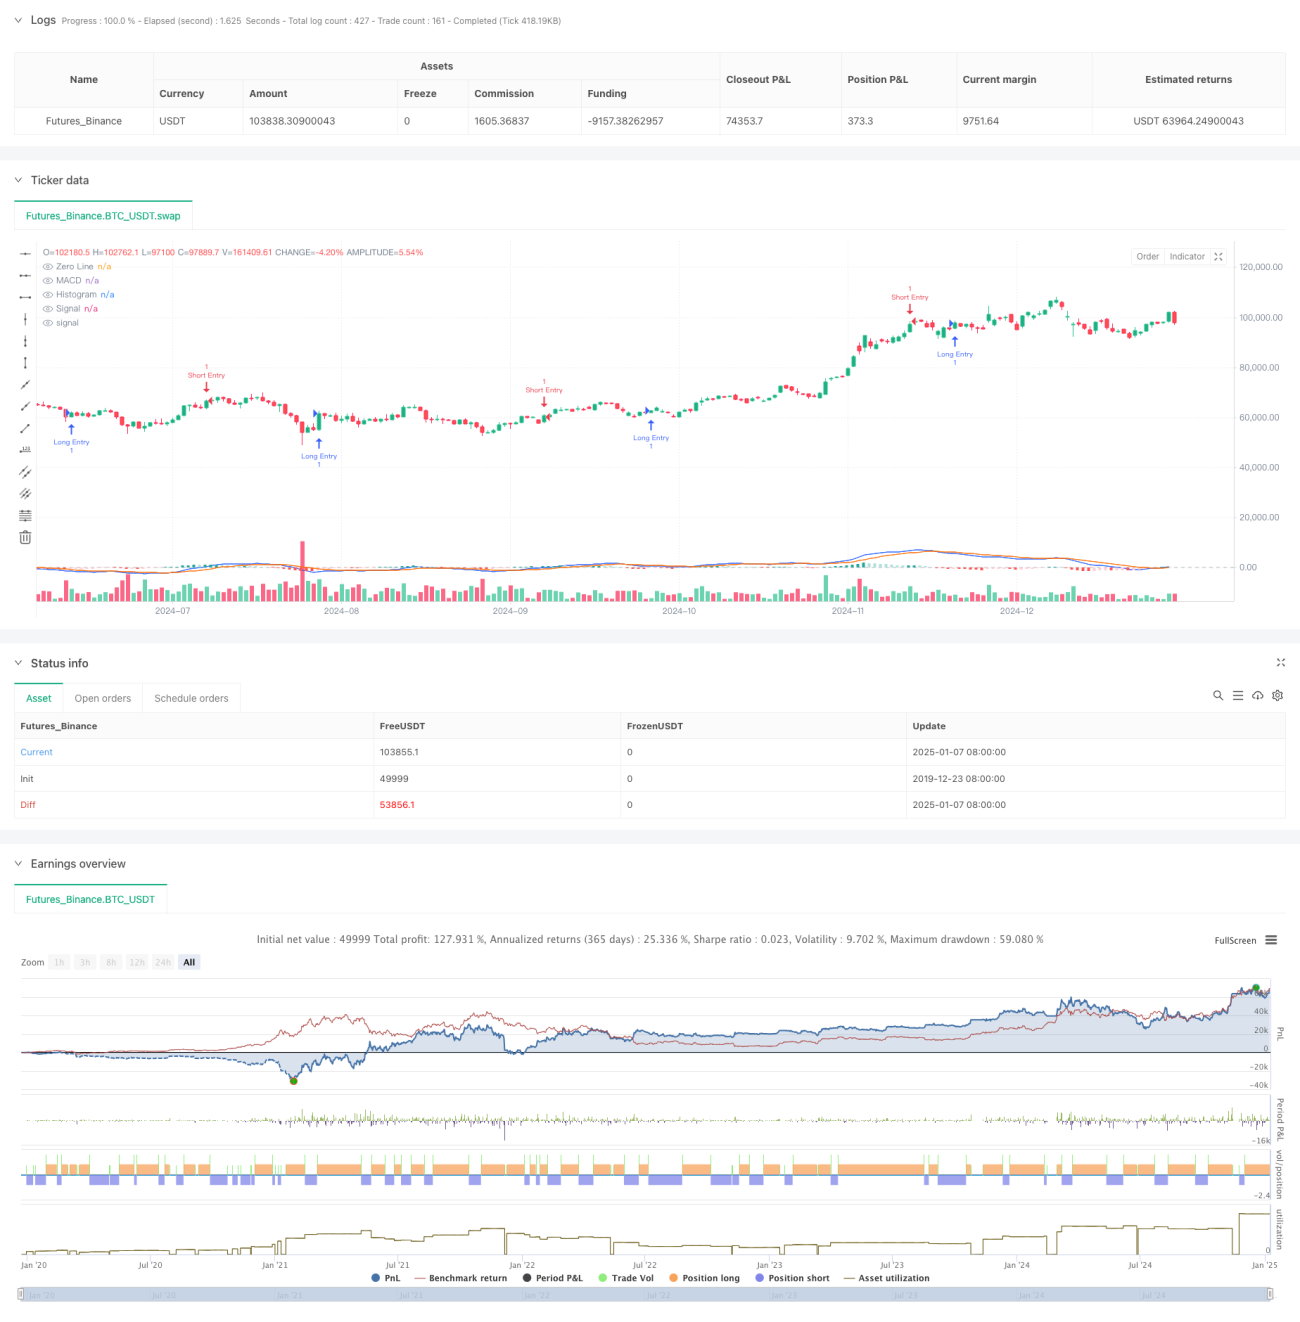
Visão geral
Esta estratégia é um sistema de negociação baseado no indicador MACD e na relação entre volume e preço. Ela determina o ponto de virada da tendência do mercado observando as mudanças no formato do histograma MACD. A estratégia adota um mecanismo dinâmico de stop-profit e stop-loss e usa o indicador ATR para se adaptar às flutuações do mercado e controlar riscos de forma eficaz.
Princípio da estratégia
A lógica central da estratégia é baseada nas mudanças colunares profundas e superficiais do indicador MACD, combinadas com o sistema de média móvel dupla EMA e SMA. Quando o histograma MACD muda de escuro para claro, isso indica uma mudança no momentum e o sistema negociará neste momento. Especificamente:
- Calcule o valor MACD usando as médias móveis rápidas (12) e lentas (26)
- MACD suavizado por uma linha de sinal de 9 períodos
- Observe as mudanças de cor do histograma MACD
- Combine o indicador ATR de 14 períodos para definir o take profit dinâmico e o stop loss
Vantagens estratégicas
- A combinação de indicadores é científica e razoável, o MACD pode capturar tendências de forma eficaz e o ATR pode se adaptar às flutuações
- As configurações de stop-profit e stop-loss são flexíveis e podem ser ajustadas de acordo com diferentes características do mercado por meio de vários parâmetros
- O sinal de negociação é claro e o tempo de entrada pode ser avaliado intuitivamente por meio da mudança de cor do gráfico de barras
- Levando em consideração transações bidirecionais longas e curtas, aumentando a aplicabilidade de estratégias e oportunidades de lucro
Risco estratégico
- O MACD como um indicador defasado pode perder o melhor ponto de entrada para movimentos rápidos do mercado
- Sinais falsos podem ser gerados em um mercado volátil, levando a negociações frequentes
- A configuração múltipla inadequada do ATR pode fazer com que o stop loss fique muito frouxo ou muito apertado
- É necessário estabelecer uma gestão de fundos razoável para evitar perdas únicas excessivas
Direção de otimização da estratégia
- Introduzir sinal de confirmação de volume para melhorar a confiabilidade do sinal
- Adicionado filtro de tendência para reduzir sinais falsos em mercados voláteis
- Otimizar os múltiplos stop-profit e stop-loss, que podem ser ajustados dinamicamente de acordo com diferentes períodos de tempo
- Adicionada filtragem de volatilidade para reduzir a frequência de negociação durante períodos de alta volatilidade
- Considere introduzir filtros de tempo para evitar negociar durante períodos desfavoráveis
Resumir
Esta é uma estratégia abrangente que combina o indicador clássico de análise técnica MACD com métodos modernos de controle de risco. Capture a mudança no momento do mercado observando as mudanças no formato do histograma MACD e use o ATR para controle dinâmico de risco. A estratégia é razoavelmente elaborada, a lógica da operação é clara e tem bom valor prático. Por meio de otimização e melhoria contínuas, espera-se que essa estratégia alcance melhor desempenho em combate real.
- 1