Acompanhamento de tendências de preço e volume de alta frequência e estratégia adaptativa de análise de volume

Visão geral
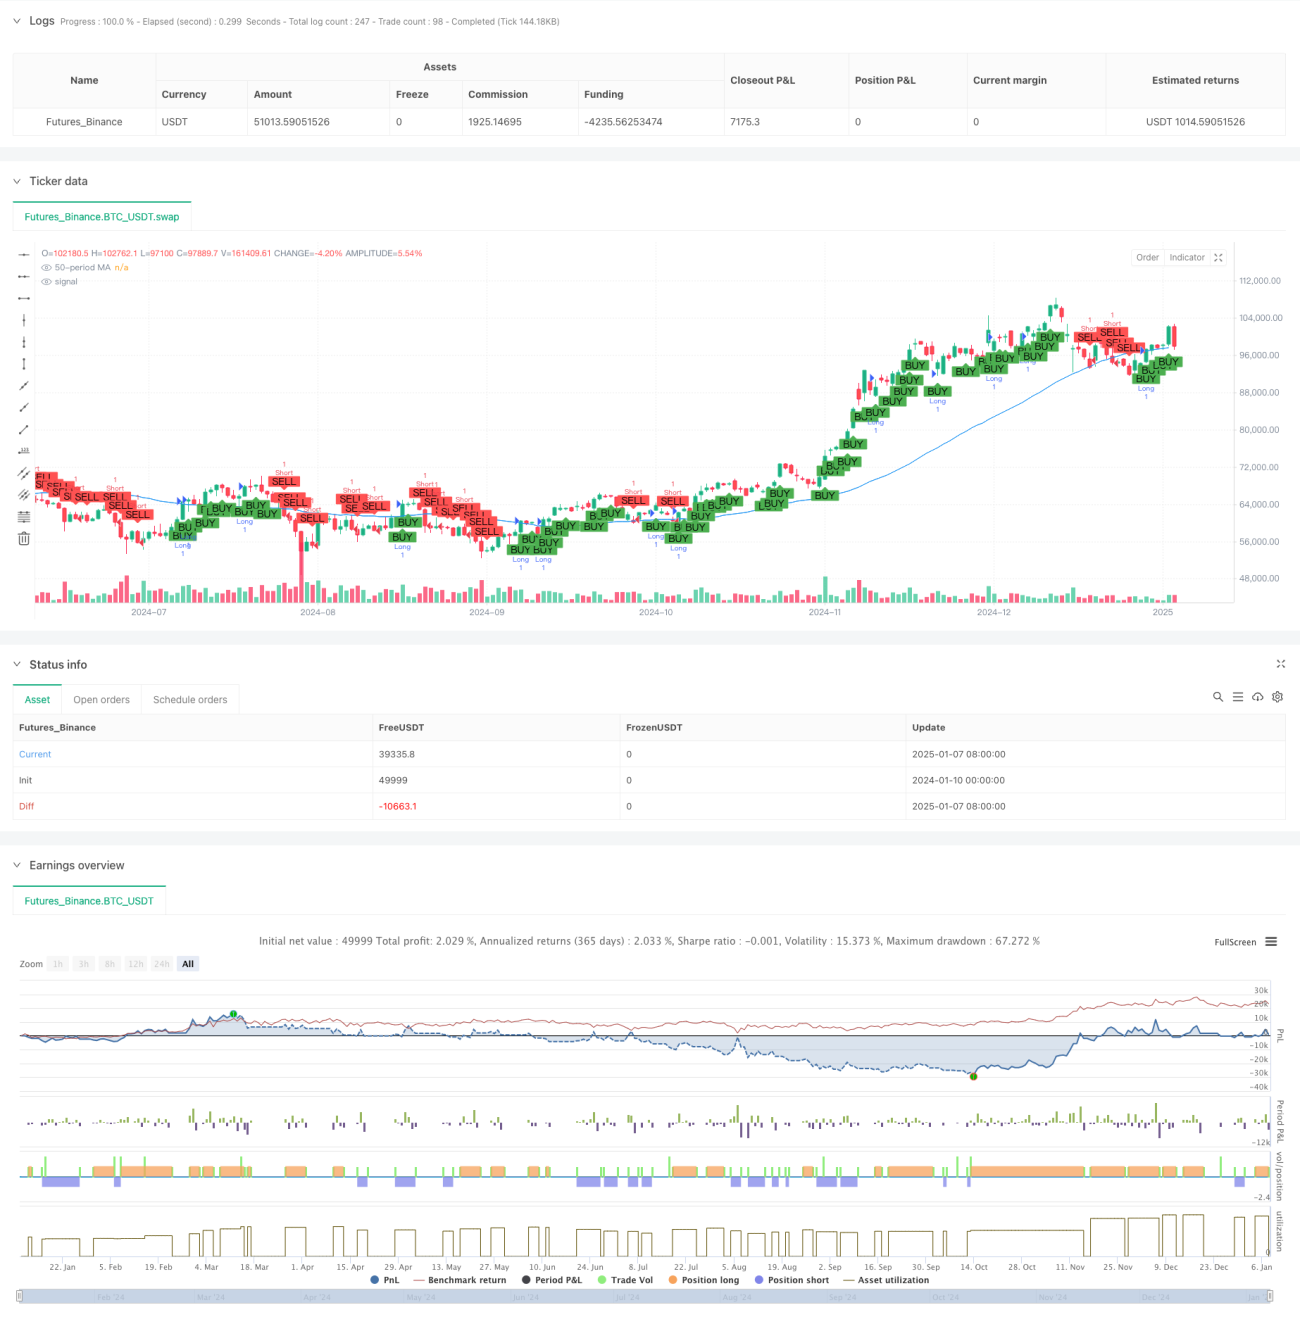
A estratégia é um sistema de negociação automatizado baseado em um período de 5 minutos que combina métodos de acompanhamento de tendência de média móvel e análise de volume. A estratégia usa uma média móvel simples (MMS) de 50 períodos para determinar tendências de mercado e introduz análise de volume para verificar a validade dos sinais de negociação. O sistema usa metas fixas de stop loss e lucro para obter negociações totalmente automatizadas.
Princípio da estratégia
A lógica central da estratégia inclui os seguintes componentes principais:
- Identificação de tendência: Use SMA de 50 períodos para determinar a direção do mercado. Quando o preço de fechamento é maior que a média móvel, é considerada uma tendência ascendente, caso contrário, é uma tendência descendente. Ao mesmo tempo, a tendência de preço nos últimos 30 minutos (6 linhas K) é combinada para confirmar a tendência.
- Análise de volume: calcule o volume de compra e venda com base nas flutuações de preço e aloque o volume dentro de cada linha K em volume de compra e volume de venda de acordo com a posição do preço de fechamento.
- Geração de sinal de negociação: Em uma tendência de alta, um sinal longo é gerado quando o volume de compra é maior que o volume de venda; em uma tendência de baixa, um sinal curto é gerado quando o volume de venda é maior que o volume de compra.
- Controle de risco: use um stop loss de 3% e uma meta de lucro de 29% para gerenciar a relação risco-recompensa de cada negociação.
Vantagens estratégicas
- Confirmação de tendência multidimensional: Ao combinar a média móvel e as tendências de preço de curto prazo para confirmar a tendência duas vezes, a precisão do julgamento da tendência é melhorada.
- Verificação de volume: introduza a análise de volume como um filtro de sinal de negociação para evitar falsos rompimentos em um ambiente de baixo volume.
- Gerenciamento de risco perfeito: defina metas claras de stop loss e lucro para controlar efetivamente o risco de uma única transação.
- Forte adaptabilidade: a estratégia pode ajustar automaticamente a direção da transação de acordo com o status do mercado e se adaptar a diferentes ambientes de mercado.
Risco estratégico
- Risco de mercado volátil: Sinais falsos de rompimento frequentes podem ocorrer em um mercado lateral e volátil, levando a stop losses contínuos.
- Risco de deslizamento: em negociações de alta frequência, você pode enfrentar grandes deslizamentos, o que pode afetar o efeito real da execução.
- Sensibilidade dos parâmetros: O efeito da estratégia é sensível a parâmetros como o período da média móvel e o período de cálculo do volume de negociação.
- Dependência do ambiente de mercado: a estratégia tem bom desempenho em um mercado com uma tendência clara, mas pode sofrer grandes quedas durante períodos de transição de tendência.
Direção de otimização da estratégia
- Otimização de parâmetros dinâmicos: Um mecanismo de parâmetros adaptáveis pode ser introduzido para ajustar dinamicamente o período de média móvel e o período de cálculo do volume de negociação de acordo com a volatilidade do mercado.
- Aumente a filtragem do ambiente de mercado: adicione indicadores de volatilidade ou indicadores de força de tendência para interromper automaticamente a negociação em condições de mercado inadequadas.
- Melhore o mecanismo de stop-loss: O stop-loss dinâmico, como o trailing stop-loss ou o stop-loss baseado em ATR, pode ser usado para aumentar a flexibilidade do controle de risco.
- Otimize a lógica de geração de sinal: considere adicionar mais indicadores técnicos para validação cruzada para melhorar a confiabilidade do sinal.
Resumir
Esta estratégia cria um sistema completo de negociação de alta frequência combinando rastreamento de tendências e análise de volume. As principais vantagens da estratégia estão em seu mecanismo de confirmação de sinal multidimensional e sistema de controle de risco perfeito. Embora existam alguns riscos inerentes, a estabilidade e a adaptabilidade da estratégia podem ser melhoradas ainda mais por meio das direções de otimização propostas. A estratégia é particularmente adequada para operar em um ambiente de mercado com tendências claras e espera-se que alcance resultados comerciais estáveis por meio de otimização razoável de parâmetros e gerenciamento de risco.
/*backtest
start: 2024-01-10 00:00:00
end: 2025-01-08 08:00:00
period: 1d
basePeriod: 1d
exchanges: [{"eid":"Futures_Binance","currency":"BTC_USDT","balance":49999}]
*/

// This Pine Script™ code is subject to the terms of the Mozilla Public License 2.0 at https://mozilla.org/MPL/2.0/
// © Jerryorange

//@version=6- 1