Sistema de comutação dinâmica multiestratégia adaptável: uma estratégia de negociação quantitativa que integra rastreamento de tendências e oscilação de intervalo

Visão geral
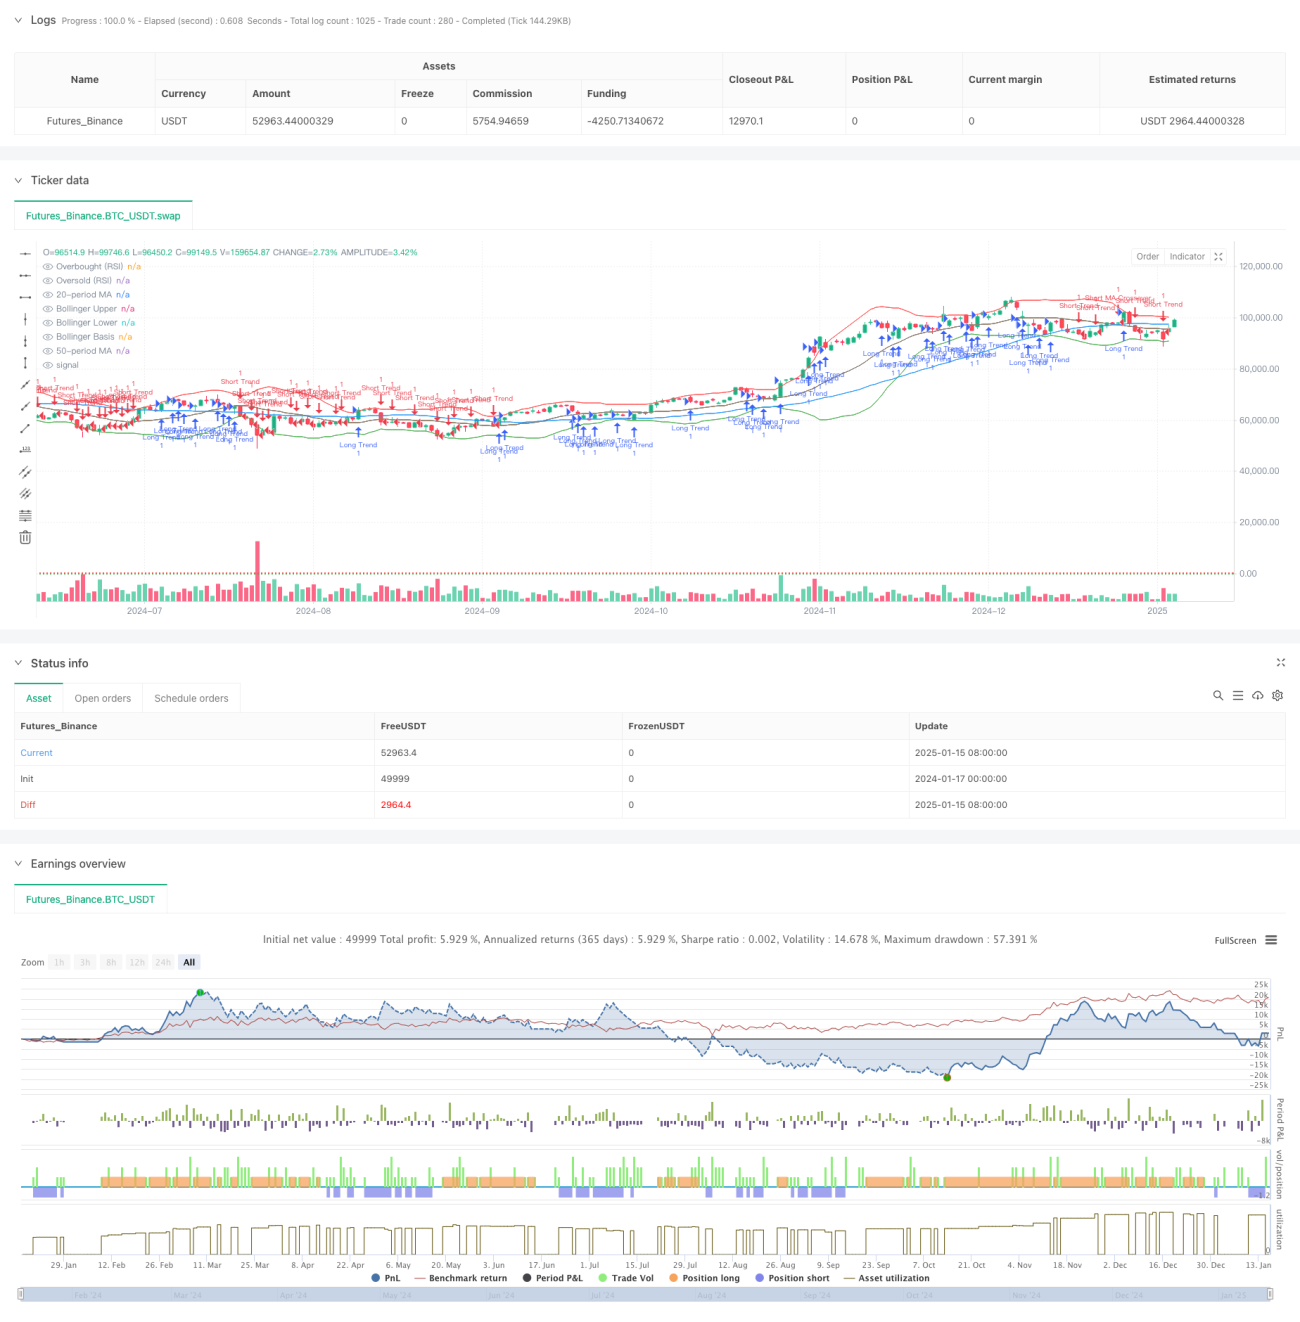
Esta estratégia é um sistema de negociação adaptável que integra vários indicadores de análise técnica e alterna entre diferentes estratégias de negociação identificando dinamicamente as condições de mercado. O sistema é baseado principalmente em três indicadores técnicos: média móvel (MA), bandas de Bollinger (BB) e índice de força relativa (RSI), e seleciona automaticamente o método de negociação mais adequado de acordo com as tendências do mercado e flutuações de intervalo. A estratégia adota soluções diferenciadas de gerenciamento de risco para mercados de tendência e variação, definindo diferentes parâmetros de take-profit e stop-loss.
Princípio da estratégia
A estratégia usa as médias móveis de 50 e 20 períodos para determinar tendências de mercado e combina os indicadores Bandas de Bollinger e RSI para identificar áreas de sobrecompra e sobrevenda. Em um mercado de tendências, o sistema negocia principalmente com base na relação entre o preço e a média móvel lenta e no cruzamento das linhas rápidas e lentas; em um mercado de intervalo, ele negocia principalmente com base nos rompimentos dos limites da Banda de Bollinger e nos sinais de sobrecompra e sobrevenda do RSI. . O sistema ajusta automaticamente o nível de take-profit de acordo com o ambiente de mercado. Um take-profit de 6% é usado para mercados de tendência e um take-profit de 4% é usado para mercados de intervalo. Um stop-loss de 2% é usado uniformemente para controlar riscos.
Vantagens estratégicas
- Forte adaptabilidade ao mercado: Capacidade de alternar automaticamente as estratégias de negociação de acordo com diferentes ambientes de mercado para melhorar a estabilidade do sistema
- Melhoria na gestão de risco: diferentes rácios de take-profit são utilizados para condições de mercado de tendência e intervalo, o que está mais em linha com as características do mercado
- Verificação multidimensional de sinais: Melhore a confiabilidade dos sinais de negociação por meio da verificação cruzada de vários indicadores técnicos
- Alto grau de automação: operação totalmente automatizada, sem necessidade de intervenção manual, reduzindo erros causados por julgamento subjetivo
Risco estratégico
- Sensibilidade dos parâmetros: A seleção de vários parâmetros de indicadores técnicos afetará o desempenho da estratégia e requer otimização de parâmetros suficiente
- Atraso na mudança de mercado: pode haver um atraso no julgamento do status do mercado, o que afeta o desempenho da estratégia
- Risco de sinal falso: Sinais de negociação falsos podem ser gerados em mercados voláteis
- Considerações sobre custos de transação: a troca frequente de estratégias pode resultar em custos de transação mais altos
Direção de otimização da estratégia
- Introdução aos indicadores de volume: Adicionando análise de volume aos indicadores técnicos existentes para melhorar a confiabilidade do sinal
- Otimizar o julgamento do status do mercado: Considere introduzir indicadores de força de tendência, como ATR e ADX, para melhorar a precisão do julgamento do status do mercado
- Ajuste dinâmico de parâmetros: ajuste automaticamente os parâmetros stop-profit e stop-loss de acordo com a volatilidade do mercado para melhorar a adaptabilidade da estratégia
- Aumentar o mecanismo de filtragem: criar condições de negociação mais rigorosas para reduzir sinais falsos
Resumir
Esta estratégia integra vários indicadores técnicos clássicos para construir um sistema de negociação adaptável que pode se adaptar a diferentes ambientes de mercado. Mantendo a operação simples, o sistema realiza a identificação dinâmica do status do mercado e a troca automática de estratégias de negociação, além de ser altamente prático. Por meio de configurações diferenciadas de take-profit e stop-loss, a estratégia mantém boa lucratividade e controla os riscos. No futuro, a estabilidade e a confiabilidade da estratégia podem ser melhoradas ainda mais com a introdução de mais indicadores técnicos e a otimização de mecanismos de ajuste de parâmetros.
- 1