Vários indicadores técnicos cruzam a tendência de momentum seguindo a estratégia

Visão geral
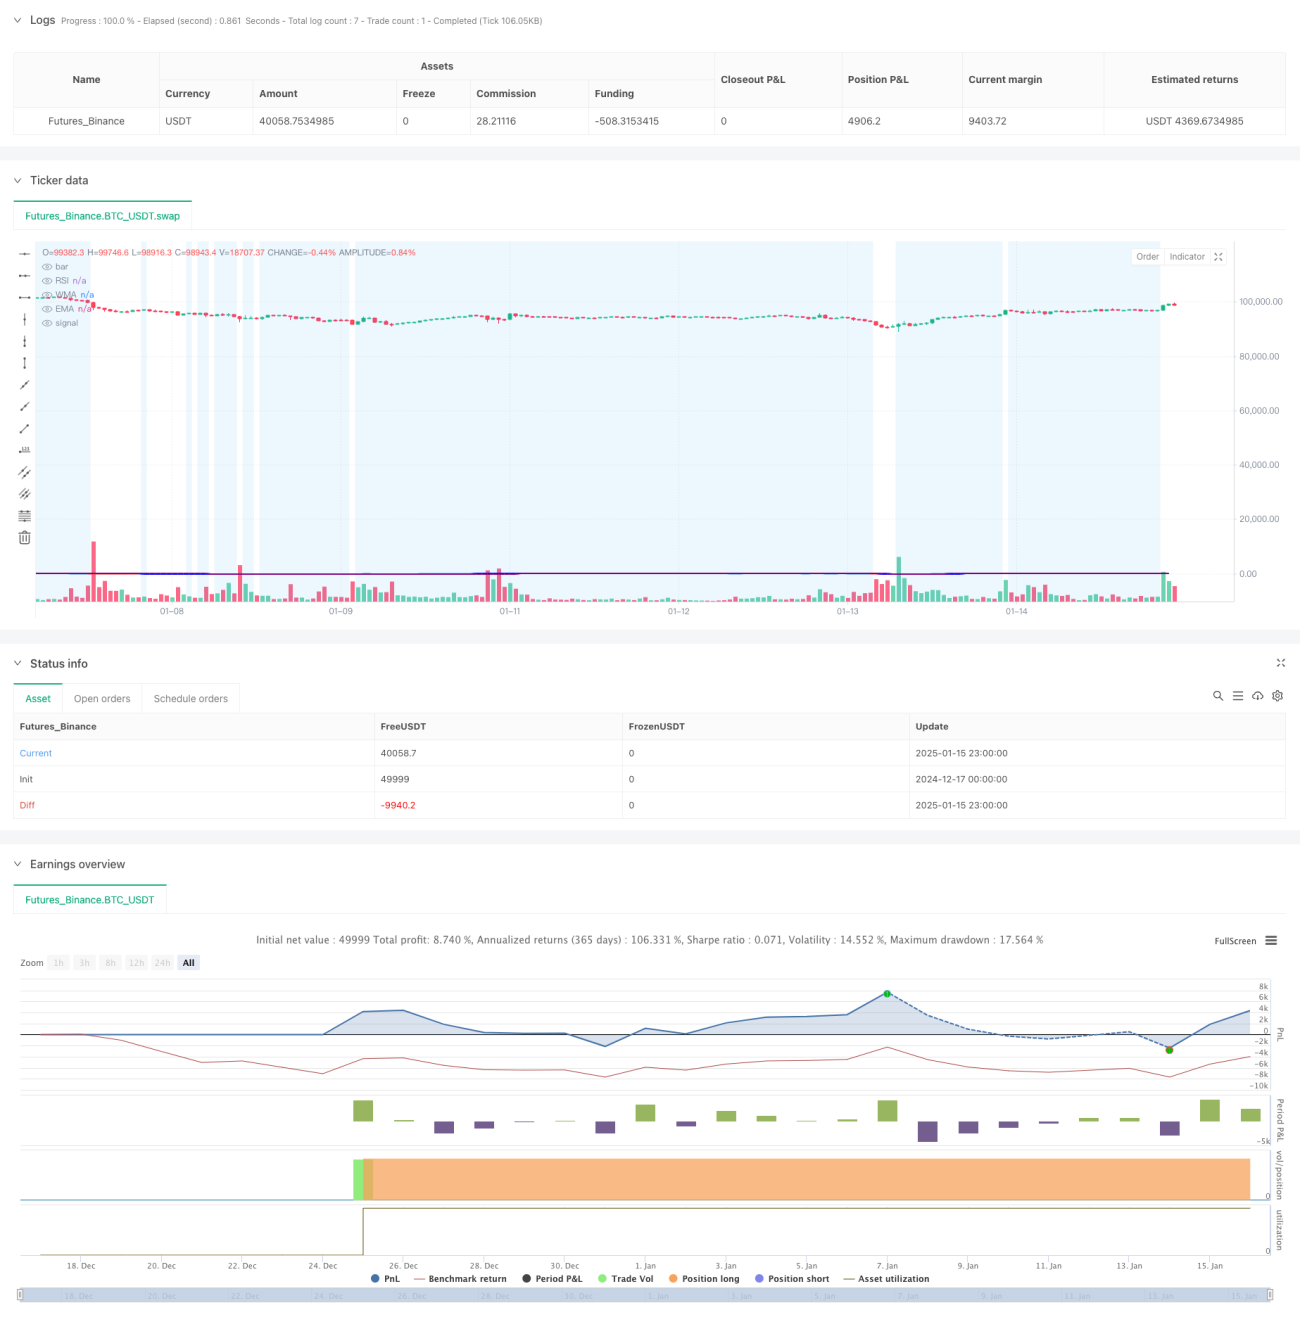
A estratégia é um sistema de negociação de acompanhamento de tendências que combina o Índice de Força Relativa (RSI), a Média Móvel Ponderada (WMA) e a Média Móvel Exponencial (EMA). A estratégia usa vários indicadores técnicos em coordenação para capturar mudanças no momento do mercado em pontos de virada de tendência, gerando assim sinais de negociação. O sistema usa o cruzamento de WMA e EMA para confirmar a direção da tendência e combina o indicador RSI para filtrar o status do mercado e melhorar a precisão das transações.
Princípio da estratégia
A lógica central da estratégia é baseada nos seguintes elementos-chave:
- O indicador RSI é calculado usando um período de 14 períodos para medir as condições de sobrecompra e sobrevenda do mercado.
- O cruzamento da MMP de 45 períodos e da MME de 89 períodos é usado para confirmar uma mudança na tendência.
- Condições de entrada:
- Sinal longo: WMA cruza acima de EMA e RSI < 50
- Sinal curto: WMA cruza abaixo de EMA e RSI>50
- O sistema visualiza o status do mercado por meio da mudança de cor do RSI. Quando RSI>70, ele exibe verde, e quando é <30, ele exibe vermelho.
- Um fundo azul é definido na faixa RSI 30-70 para ajudar a identificar áreas neutras
Vantagens estratégicas
- A combinação de vários indicadores técnicos melhora a confiabilidade dos sinais de negociação
- A WMA é mais responsiva às mudanças recentes de preços, enquanto a EMA continua acompanhando a tendência de longo prazo.
- O RSI atua como um filtro para evitar efetivamente sinais falsos em mercados excessivamente voláteis
- O design da interface visual ajuda os comerciantes a julgar intuitivamente o status do mercado
- Inclui um sistema de alerta completo para notificar prontamente os comerciantes sobre potenciais oportunidades de negociação
Risco estratégico
- Sinais frequentes de falsos rompimentos podem ocorrer em um mercado lateral
- O atraso da média móvel pode causar um ligeiro atraso na entrada
- As configurações fixas para limites de RSI podem não ser apropriadas em todos os ambientes de mercado
- Não levar em conta a volatilidade pode aumentar o risco durante períodos de alta volatilidade
- A ausência de mecanismos de stop loss e stop profit pode afetar o efeito da gestão de fundos
Direção de otimização da estratégia
- Introdução de limites RSI adaptáveis para ajuste dinâmico de acordo com as flutuações do mercado
- Adicione o indicador ATR para controlar o tamanho da posição e definir o stop loss dinâmico
- Otimize as configurações do período WMA e EMA e considere ajustá-las de acordo com diferentes períodos de tempo
- Adicionar indicador de volume como um sinal de confirmação auxiliar
- Implementar sistemas de gestão de posições mais complexos, como pirâmides e redução de posições
Resumir
Esta é uma estratégia de rastreamento de tendências baseada em múltiplos indicadores técnicos. Por meio do uso coordenado de RSI, WMA e EMA, ela se esforça para capturar pontos de virada de tendência de mercado, ao mesmo tempo em que garante estabilidade de negociação. Embora existam certos riscos de histerese e sinais falsos, por meio de medidas razoáveis de otimização e gerenciamento de riscos, essa estratégia tem bom valor prático e espaço de expansão.
- 1