
Visão geral
Trata-se de uma estratégia de acompanhamento de tendências baseada em múltiplos indicadores técnicos e gerenciamento de risco. A estratégia utiliza vários indicadores técnicos como a média móvel, o indicador de força relativa (RSI) e o indicador de movimento (DMI) para identificar tendências de mercado e proteger a segurança dos fundos por meio de meios de controle de risco como stop loss dinâmico, gerenciamento de posições e limite máximo de retirada mensal. O núcleo da estratégia é confirmar a eficácia das tendências por meio de indicadores técnicos multidimensionais, ao mesmo tempo em que controla rigorosamente o risco.
Princípio da estratégia
A estratégia usa mecanismos de confirmação de tendências em vários níveis:
- A direção da tendência é determinada pela média móvel (EMA) através do índice de 8/21/50
- Usar a linha média do canal de preço como um filtro de tendência
- Combinando o movimento da linha média do RSI (de 5 ciclos) na faixa 35-65 para filtrar brechas falsas
- Confirmação da intensidade da tendência através do indicador DMI (ciclo 14)
- Utilizando indicadores de dinâmica (~ 8 ciclos) e amplificação de volume de transação para verificar a continuidade da tendência
- A utilização de stop loss dinâmico baseado no ATR para controlar o risco
- Gestão de posições de risco fixo, com um limite de risco de 5% do capital inicial por transação
- Configurar um limite máximo de retirada mensal de 10% para evitar perdas excessivas
Vantagens estratégicas
- Verificação cruzada de múltiplos indicadores tecnológicos para maior precisão na determinação de tendências
- O mecanismo de stop loss dinâmico controla o risco de uma única transação
- Gestão de posições com risco fixo torna o uso de fundos mais racional
- Limitação de levantamento máximo mensal oferece proteção contra riscos sistemáticos
- Indicadores de volume de transação combinados aumentam a confiabilidade da confirmação de tendências
- A configuração de ganhos e perdas de 2:1 melhora a rentabilidade a longo prazo
Risco estratégico
- O uso de múltiplos indicadores pode causar atraso no sinal
- Falso sinal pode ser frequente em mercados em turbulência
- O modelo de risco fixo pode não ser suficientemente flexível em situações de forte flutuação
- Restrições de levantamento mensal podem levar a perda de oportunidades importantes
- A tendência pode sofrer uma reversão maior
Direção de otimização da estratégia
- Introdução de parâmetros de indicadores adaptáveis para diferentes contextos de mercado
- Desenvolver um esquema de gestão de posições mais flexível, levando em conta as variações na volatilidade do mercado
- Avaliação quantitativa da intensidade da tendência e otimização do tempo de entrada
- Desenho de um mecanismo mensal de limitação de risco mais inteligente
- Adição de módulo de identificação do cenário de mercado para ajustar parâmetros de estratégia em diferentes condições de mercado
Resumir
A estratégia estabelece um sistema de negociação de acompanhamento de tendências relativamente completo, através da aplicação integrada de indicadores técnicos multidimensionais. A vantagem da estratégia reside no seu quadro abrangente de gestão de risco, incluindo stop loss dinâmico, gestão de posição e controle de retração. Embora haja um certo risco de atraso, a estratégia espera manter um desempenho estável em diferentes ambientes de mercado através de otimização e melhoria.
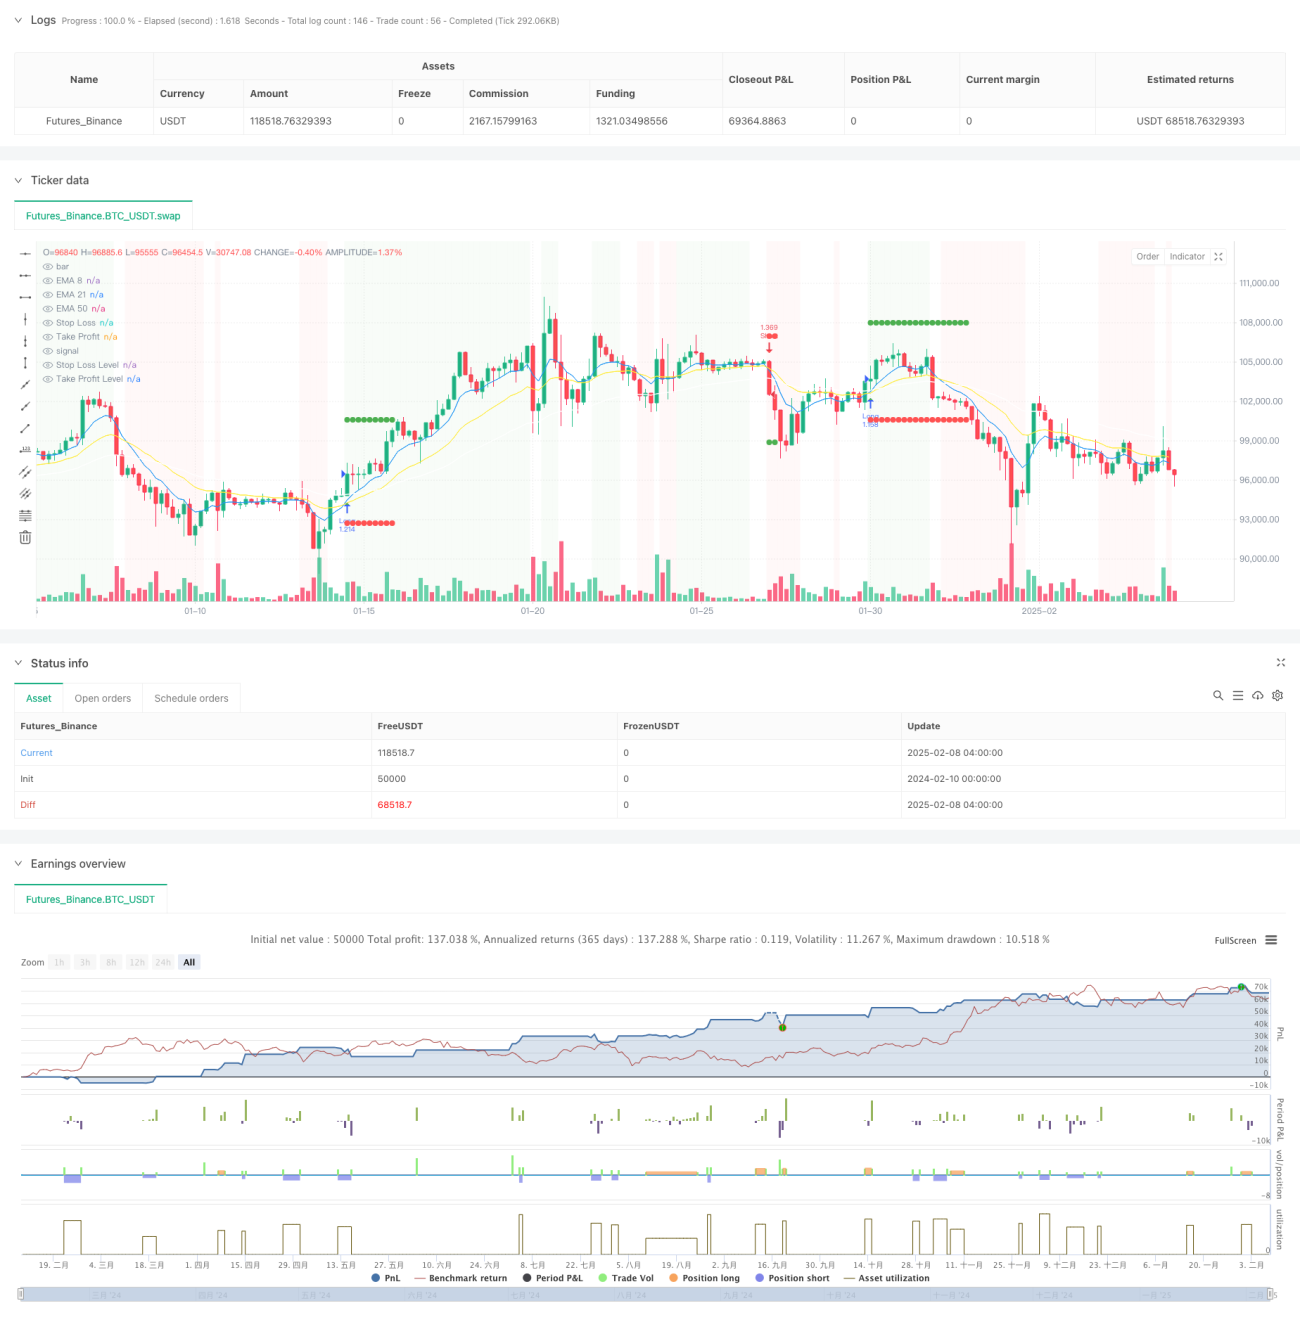
/*backtest
start: 2024-02-10 00:00:00
end: 2025-02-08 08:00:00
period: 4h
basePeriod: 4h
exchanges: [{"eid":"Futures_Binance","currency":"BTC_USDT"}]
*/

//@version=5
strategy("High Win-Rate Crypto Strategy with Drawdown Limit", overlay=true, initial_capital=10000, default_qty_type=strategy.fixed, process_orders_on_close=true)

// Moving Averages- 1