
A estratégia é um sistema de negociação quantitativa baseado em um canal de regressão linear e um gráfico de Heinrich Ansch, combinado com um mecanismo de stop-loss dinâmico, especialmente para aproveitar oportunidades de rápida flutuação no mercado.
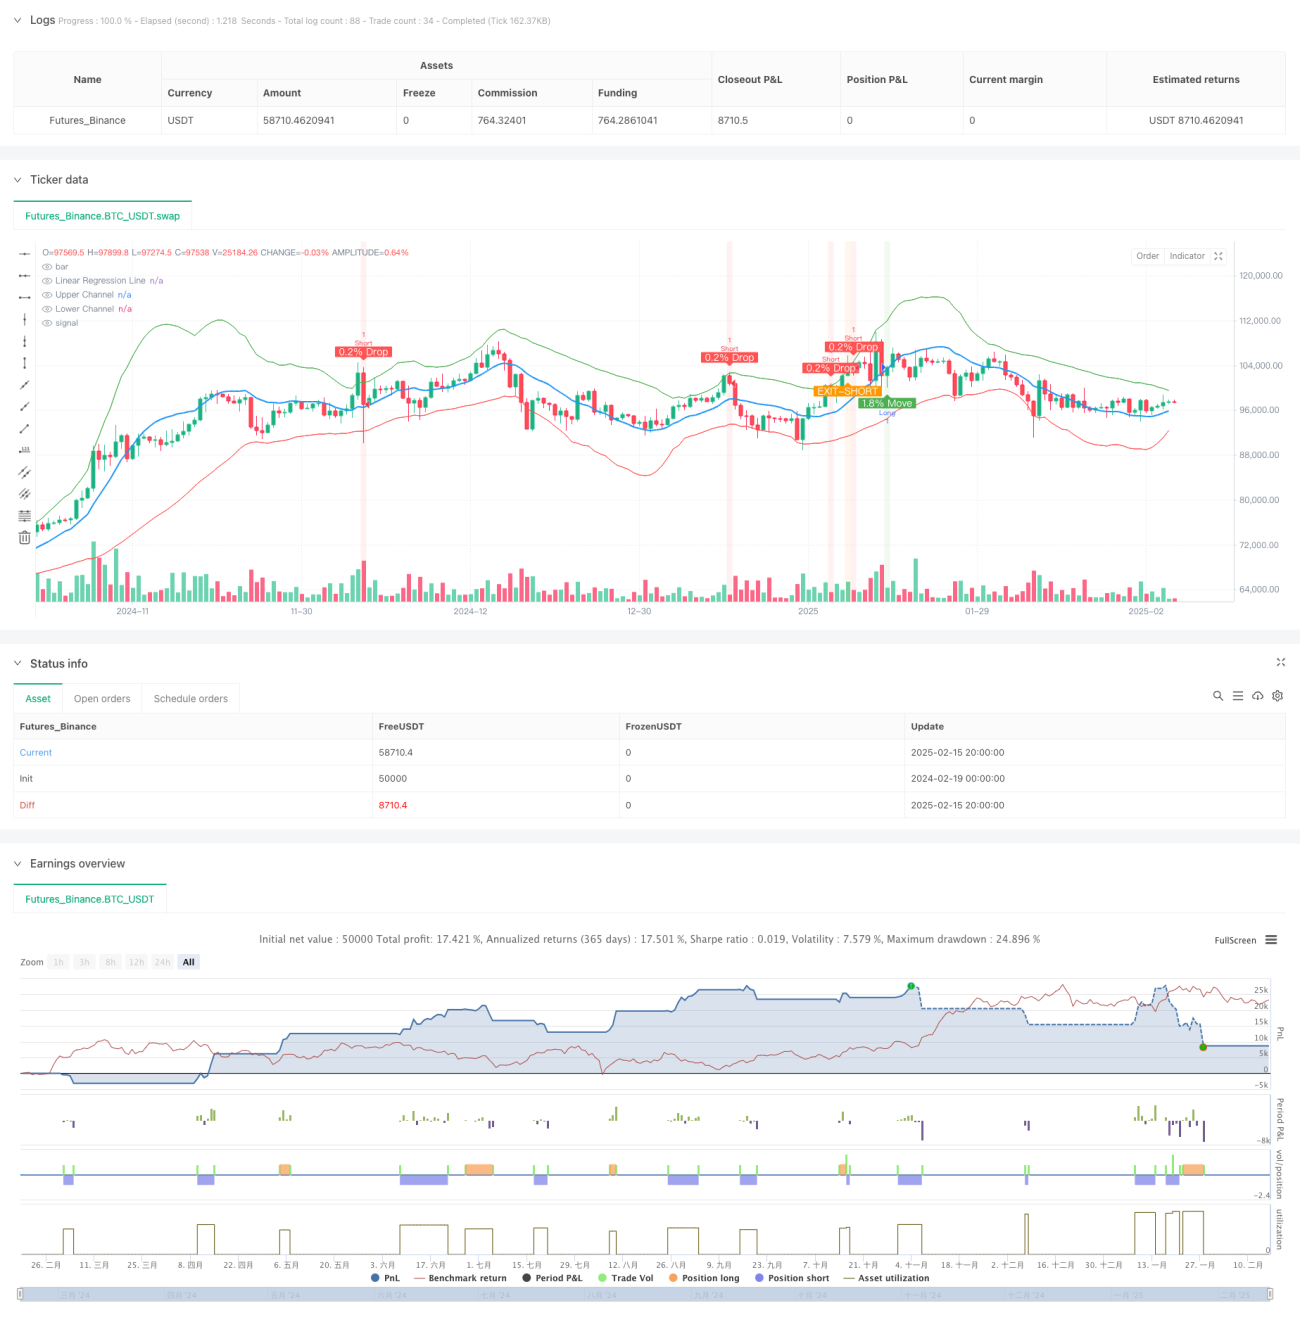
A estratégia usa o canal de regressão linear como sua principal estrutura de negociação, identificando potenciais oportunidades de negociação monitorando o movimento dos preços dentro do canal. Quando os preços atravessam o canal de descida e apresentam uma alta superior a 1,8%, o sistema emite um sinal de multiplicação; quando os preços atravessam o canal de ascensão e apresentam uma queda superior a 0,2%, o sistema emite um vazio. A estratégia de sinalização também integra um sistema de saída dinâmica baseado no gráfico de Einstein, bem como um mecanismo de gerenciamento de risco de parada de 10% e perda de 5%.
O núcleo da estratégia é baseado em um cálculo de regressão linear de 30 ciclos, definindo a largura do canal por 2 vezes o diferencial padrão. O sinal de entrada é baseado nas seguintes condições:
A estratégia oferece aos traders um sistema de negociação relativamente completo, através da combinação de um canal de regressão linear e uma ruptura de preço. Sua vantagem é a combinação de vários indicadores técnicos e medidas de controle de risco, mas ainda precisa ser otimizada e ajustada de acordo com as condições reais do mercado.
/*backtest
start: 2024-02-19 00:00:00
end: 2025-02-16 08:00:00
period: 12h
basePeriod: 12h
exchanges: [{"eid":"Futures_Binance","currency":"BTC_USDT"}]
*/
//@version=6
strategy('STRATEGY WITH SL', overlay=true)
// Parameters for Linear Regression
length = input.int(30, title='Linear Regression Length')
mult = input.float(2.0, title='Channel Multiplier', step=0.1)
// Calculate Linear Regression
regression_line = ta.linreg(close, length, 0)
// Calculate Standard Deviation
stddev = ta.stdev(close, length)
// Upper and Lower Channel Boundaries
upper_channel = regression_line + mult * stddev
lower_channel = regression_line - mult * stddev
// Plot the Linear Regression and Channel
plot(regression_line, color=color.blue, linewidth=2, title='Linear Regression Line')
plot(upper_channel, color=color.green, linewidth=1, title='Upper Channel')
plot(lower_channel, color=color.red, linewidth=1, title='Lower Channel')
// Parameters for Price Move Check (Indicator 1: 1.8% Move)
threshold_move = 1.8
large_threshold_move = 5.0
timeframe_for_large_move = 120
// Calculate the percentage change over the last 3 minutes
priceChange = (close - close[3]) / close[3] * 100
// Calculate the percentage change over the last 2 hours (120 minutes)
priceChange2Hour = (close - close[120]) / close[120] * 100
// Condition for a price move greater than 1.8%
isPriceUp = priceChange > threshold_move
// Condition for price move greater than 5% in 2 hours (no alert if true)
isLargePriceMove = priceChange2Hour > large_threshold_move
// Parameters for Price Drop Check (Indicator 2: 0.2% Drop)
threshold_drop = 0.2 / 100 // 0.2% threshold
// Get the price 3 minutes ago
price_3min_ago = request.security(syminfo.tickerid, '3', close[1])
// Calculate the percentage drop over the last 3 minutes
price_drop = (close - price_3min_ago) / price_3min_ago
// Condition for a 0.2% drop
drop_condition = price_drop <= -threshold_drop
// Track whether the price has crossed the upper or lower Linear Regression channel
var bool lower_crossed = false
var bool upper_crossed = false
var bool move_after_cross = false
var bool alert_sent = false
// Reset flags when price crosses channels
if (close < lower_channel)
lower_crossed := true
move_after_cross := false
if (close > upper_channel)
upper_crossed := true
alert_sent := false
// Combine both conditions for price crossing lower and upper channels and move/drop conditions
final_condition_long = lower_crossed and isPriceUp and not move_after_cross and not isLargePriceMove
final_condition_short = upper_crossed and drop_condition and not alert_sent
// Set flags when conditions are met
if (final_condition_long)
move_after_cross := true
if (final_condition_short)
alert_sent := true
// Heikin-Ashi calculation for dynamic timeframe (3-minute)
heikin_open = (open + close) / 2
heikin_close = (open + high + low + close) / 4
heikin_high = math.max(high, math.max(heikin_open, heikin_close))
heikin_low = math.min(low, math.min(heikin_open, heikin_close))
// Conditions for EXIT signals based on Heikin-Ashi candle body
exit_long_condition = (heikin_open > lower_channel and heikin_close < lower_channel) or (heikin_open < lower_channel and heikin_close > lower_channel)
exit_short_condition = heikin_open < upper_channel and heikin_close > upper_channel
// Strategy logic: Enter long or short based on the combined conditions
// Long Entry Condition
if (final_condition_long)
strategy.entry('Long', strategy.long)
// Short Entry Condition
if (final_condition_short)
strategy.entry('Short', strategy.short)
// Exit Conditions (EXIT-LONG and EXIT-SHORT)
if (exit_long_condition)
strategy.close('Long')
if (exit_short_condition)
strategy.close('Short')
// Take Profit and Stop Loss
take_profit = 10 / 100 // 10% Take Profit
stop_loss = 5 / 100 // 5% Stop Loss
// Calculate Take Profit and Stop Loss levels based on entry price
long_take_profit = strategy.position_avg_price * (1 + take_profit)
long_stop_loss = strategy.position_avg_price * (1 - stop_loss)
short_take_profit = strategy.position_avg_price * (1 - take_profit)
short_stop_loss = strategy.position_avg_price * (1 + stop_loss)
// Apply Take Profit and Stop Loss for Long and Short positions
strategy.exit('Take Profit/Stop Loss Long', from_entry='Long', limit=long_take_profit, stop=long_stop_loss)
strategy.exit('Take Profit/Stop Loss Short', from_entry='Short', limit=short_take_profit, stop=short_stop_loss)
// Plot background color when the conditions are met (for visual aid)
bgcolor(final_condition_long ? color.new(color.green, 90) : na, title='Price Move Alert After Lower Channel Crossed')
bgcolor(final_condition_short ? color.new(color.red, 90) : na, title='Price Drop Alert After Upper Channel Crossed')
bgcolor(exit_long_condition ? color.new(color.blue, 90) : na, title='EXIT-LONG Alert')
bgcolor(exit_short_condition ? color.new(color.orange, 90) : na, title='EXIT-SHORT Alert')
// Plot shapes when conditions are met
plotshape(final_condition_long, style=shape.labelup, location=location.belowbar, color=color.green, text='1.8% Move', textcolor=color.white, size=size.small)
plotshape(final_condition_short, style=shape.labeldown, location=location.abovebar, color=color.red, text='0.2% Drop', textcolor=color.white, size=size.small)
plotshape(exit_long_condition, style=shape.labeldown, location=location.abovebar, color=color.purple, text='EXIT-LONG', textcolor=color.white, size=size.small)
plotshape(exit_short_condition, style=shape.labelup, location=location.belowbar, color=color.orange, text='EXIT-SHORT', textcolor=color.white, size=size.small)
// Alert conditions for price moves and exits
alertcondition(final_condition_long, title="Price Move > 1.8% After Lower LR Channel Cross", message="Price crossed the lower Linear Regression Channel and moved more than 1.8% in the last 3 minutes!")
alertcondition(final_condition_short, title="Price Drop > 0.2% After Upper LR Channel Cross", message="Price crossed the upper Linear Regression Channel and dropped more than 0.2% in the last 3 minutes!")
alertcondition(exit_long_condition, title="EXIT-LONG: Heikin-Ashi Candle Body Crossing Lower LR Channel", message="The body of a 3-minute Heikin-Ashi candle is crossing outside the lower Linear Regression Channel.")
alertcondition(exit_short_condition, title="EXIT-SHORT: Heikin-Ashi Candle Body Crossing Upper LR Channel", message="The body of a 3-minute Heikin-Ashi candle is crossing outside the upper Linear Regression Channel.")