Vários indicadores cruzam a estratégia de negociação de rastreamento de tendência adaptável dinâmica

Visão geral
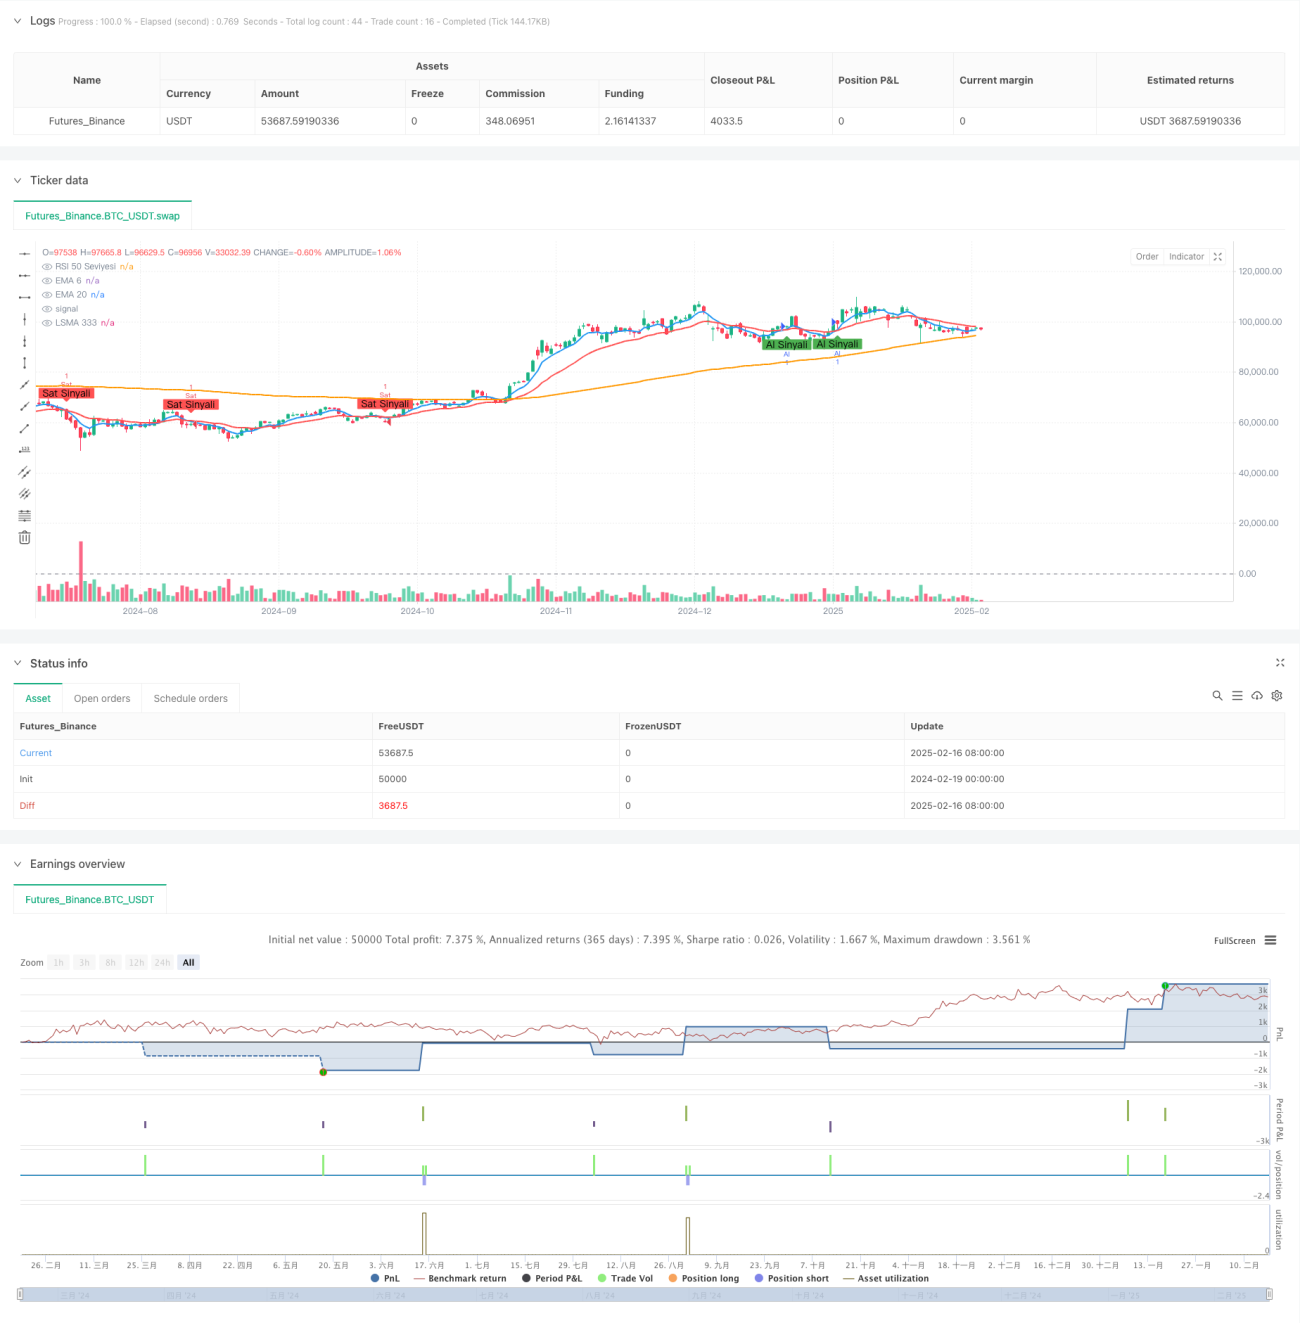
A estratégia é um sistema de rastreamento de tendências baseado em vários indicadores tecnológicos cruzados, combinando os três indicadores EMA, LSMA e RSI para filtrar oportunidades de negociação por meio de confirmação de múltiplos sinais. A estratégia usa um mecanismo de stop-loss adaptável que pode ajustar os parâmetros de gerenciamento de risco de acordo com a dinâmica do mercado.
Princípio da estratégia
A lógica central da estratégia é a seguinte:
- Usando EMAs de curto período () (6) e longo período () (20) para capturar os pontos de viragem da tendência
- Usando o LSMA ((333)) como um indicador de confirmação de tendências de longo prazo
- Usar a linha divisória de 50 do RSI ((14) como critério para avaliar a força e a fraqueza do mercado
- O que é uma posição extra quando se cumpre as seguintes condições:
- EMA 6 com EMA 20
- Preço acima do LSMA333
- RSI maior que 50
- A posição vazia é aberta quando:
- EMA 6 com EMA 20
- Preços abaixo do LSMA333
- RSI menor que 50
Vantagens estratégicas
- Confirmação cruzada de múltiplos indicadores reduz significativamente o impacto de sinais falsos
- Combinação de rastreamento de tendências e indicadores de dinâmica para aumentar a confiabilidade do sinal
- Um mecanismo de stop-loss adaptável, que pode ser ajustado de forma flexível às condições do mercado
- A lógica da estratégia é clara e os parâmetros são altamente ajustáveis
- A análise multidimensional do mercado aumenta a probabilidade de sucesso das transações
Risco estratégico
- Sinais falsos frequentes podem ocorrer em mercados voláteis
- Vários indicadores podem confirmar que o momento da entrada está ligeiramente atrasado
- Stop-loss e take-profit de porcentagem fixa podem não ser adequados para todas as condições de mercado
- A otimização excessiva dos parâmetros pode levar ao overfitting
- O que pode ser perdido em uma negociação rápida
Direção de otimização da estratégia
- Introdução de um indicador de volatilidade para ajustar dinamicamente a proporção de stop loss
- Aumentar a análise de volume de transações para confirmar a eficácia das tendências
- Considere adicionar um sistema de classificação de cenários de mercado, usando diferentes parâmetros em diferentes condições de mercado
- Mecanismos de adaptação para otimizar parâmetros de indicadores
- Adição de um sistema de gestão de localização para um controlo de posição mais flexível
Resumir
A estratégia, através da combinação do uso de múltiplos indicadores técnicos, constrói um sistema de acompanhamento de tendências relativamente robusto. A vantagem central da estratégia reside na confiabilidade da confirmação do sinal, mas também precisa prestar atenção à adaptabilidade em diferentes ambientes de mercado. Com otimização e melhoria contínua, a estratégia tem a possibilidade de obter um melhor desempenho em negociações reais.
- 1