Tendência de acompanhamento de média móvel de volume dinâmico e estratégia de negociação de breakout HLCC4

Visão geral
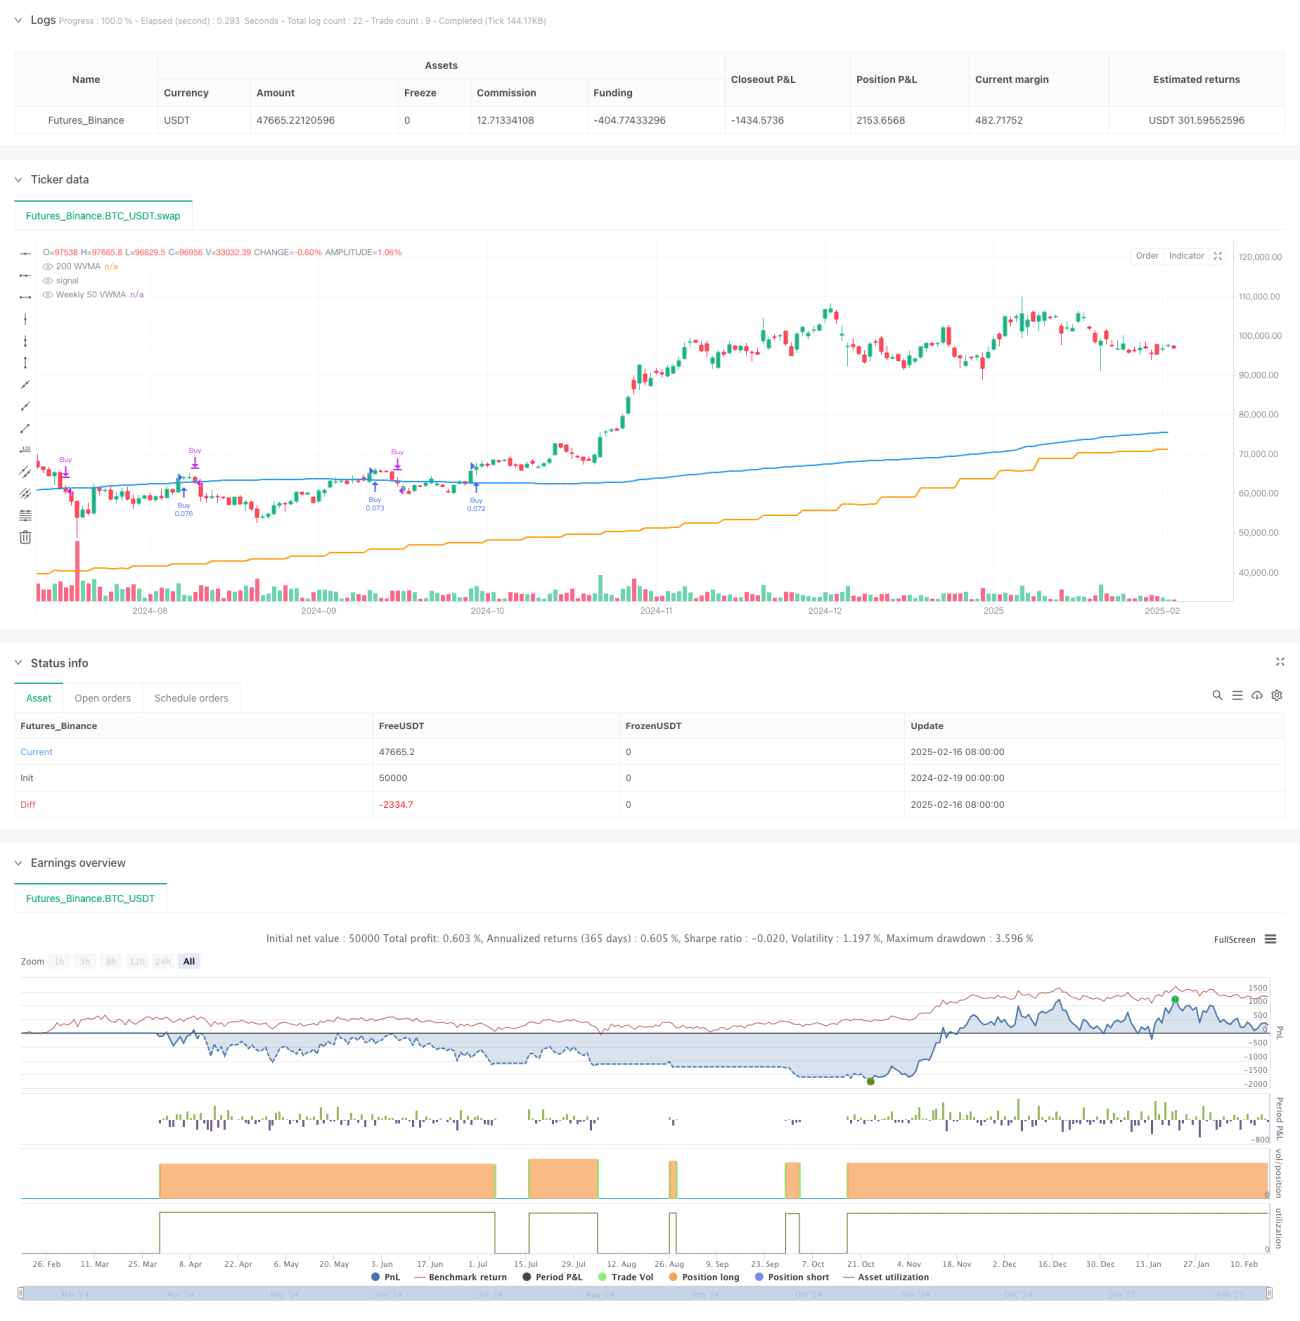
A estratégia é um sistema de acompanhamento de tendências baseado em múltiplos períodos de tempo, combinando a média móvel ponderada de volume de transação de 50 ciclos (VWMA) como um filtro de tendências maiores e usando o VWMA de 200 ciclos e a brecha de preço HLCC4 do ciclo de tempo atual como um sinal de negociação específico. É uma estratégia de apenas fazer mais, aumentando a confiabilidade da negociação com a confirmação de tendências rigorosas e a verificação de múltiplos períodos de tempo.
Princípio da estratégia
A lógica central da estratégia inclui os seguintes elementos-chave:
- Usando o VWMA de 50 períodos de percurso como padrão de grande tendência, só é permitido abrir uma posição quando o preço está acima dessa linha média.
- Os requisitos de admissão exigem que os dois preços de fechamento de linha K consecutivos estejam acima do VWMA de 200 ciclos, e que o preço de fechamento da segunda linha K seja maior que o valor médio HLCC4 da primeira linha K.
- O sinal de saída é baseado no nível da linha do dia, e o preço de fechamento da linha do dia é fechado quando a linha do dia cai abaixo do VWMA de 200 ciclos.
- A estratégia utiliza um método de gestão de posições fixas, utilizando 10% da participação da conta em cada transação.
- O prazo semanal de retrospectiva dos últimos 5 anos garante a eficácia da estratégia no ambiente de mercado atual.
Vantagens estratégicas
- Verificação de múltiplos períodos de tempo: através da combinação de linha de circunferência e linha de sol, é possível entender as grandes tendências e responder às mudanças no mercado em tempo hábil.
- Controle de risco perfeito: o uso de VWMA em vez de uma média móvel simples pode refletir melhor a tendência real do mercado.
- A confirmação de tendências é rigorosa: exigem que vários critérios sejam preenchidos simultaneamente para a entrada, reduzindo o risco de falsas brechas.
- Gestão racional de posições: a gestão de posições de proporção fixa controla o risco e mantém a margem de lucro.
- Alto nível de automação: estratégia de lógica clara, que permite a realização de transações totalmente automatizadas.
Risco estratégico
- Risco de reversão de tendência: pode haver uma grande retração em meio a fortes flutuações no mercado.
- Efeito de ponto de deslizamento: quando o mercado é pouco líquido, o preço de negociação real pode ter um desvio do preço teórico.
- Sinais de atraso: devido à utilização de uma linha média de períodos mais longos, a estratégia pode ter um atraso na resposta aos pontos de mudança de tendência.
- Risco de falha de invasão: Apesar de várias confirmações, é possível que haja prejuízos de falha de invasão.
- Limitação de negociação unidirecional: a estratégia é apenas fazer mais e perder oportunidades potenciais de shorting em uma tendência de queda.
Direção de otimização da estratégia
- Otimização de parâmetros dinâmicos: os parâmetros periódicos do VWMA podem ser automaticamente ajustados de acordo com a volatilidade do mercado.
- Optimização da gestão de posições: introdução de um sistema de gestão de posições dinâmico baseado na volatilidade.
- Melhorias no mecanismo de saída: pode ser adicionado um stop móvel ou um stop dinâmico baseado em indicadores técnicos.
- Aumentar os indicadores de sentimento do mercado: Combine indicadores como RSI ou MACD para aumentar a confiabilidade do sinal.
- Introdução à análise de volume de transação: aprofundar a análise do volume de transação, otimizar a metodologia de cálculo do VWMA.
Resumir
Trata-se de uma estratégia de seguimento de tendências rigorosamente projetada, que permite um melhor controle de risco por meio da combinação de múltiplos períodos de tempo e condições de negociação rigorosas. A principal vantagem da estratégia reside no seu mecanismo de confirmação de tendências perfeito e na lógica de negociação clara, adequada para aproveitar as oportunidades de tendências de médio e longo prazo em mercados fortes.
/*backtest
start: 2024-02-19 00:00:00
end: 2025-02-17 00:00:00
period: 1d
basePeriod: 1d
exchanges: [{"eid":"Futures_Binance","currency":"BTC_USDT"}]
*/

//@version=6
strategy("Long-Only 200 WVMA + HLCC4 Strategy (Weekly 50 VWMA Filter, Daily Exit, Last 5 Years)", overlay=true, default_qty_type=strategy.percent_of_equity, default_qty_value=10)

// Parameters- 1