
Visão geral
A estratégia é um sistema de negociação de acompanhamento de tendências baseado nos padrões de breakouts e trajectórias de linhas. A estratégia identifica os trajectórios de três trajetórias consecutivas de breakouts de linhas e, em combinação com a localização do preço de fechamento na entidade de trajectória, determina o sinal de negociação. O sistema usa um padrão de risco-benefício de 1:1 para gerenciar o stop loss e o stop loss de cada transação.
Princípio da estratégia
A lógica central da estratégia é baseada nos seguintes elementos-chave:
- Usando a faixa de Bryn com 20 ciclos como principal indicador, o fator de diferença padrão é de 2.0
- Condição de entrada múltipla: três linhas K consecutivas de fechamento do preço de fechamento quebraram o caminho, e esses três linhas K são linhas de fechamento, e o preço de fechamento está localizado na metade superior da entidade
- Condição de entrada em branco: três linhas K consecutivas de fechamento do preço de fechamento quebraram o trilho, e os três linhas K são linhas negativas, e o preço de fechamento está localizado na metade inferior da entidade
- O ponto de parada está no limite da linha K do primeiro sinal.
- Risco-retorno baseado em 1:1 em relação a posições de parada definidas
Vantagens estratégicas
- Método de confirmação múltipla para reduzir o risco de falsas rupturas através de três rupturas consecutivas da linha K.
- Combinado com a localização do preço de fechamento na linha K, aumenta a confiabilidade da confirmação de tendências
- Gerenciamento de posições com uma relação de risco/benefício fixa, facilitando o controle de risco
- A lógica da estratégia é clara, fácil de entender e implementar
- Apresentação de sinais de negociação de forma intuitiva, facilitando a análise de retracção por meio de marcas
Risco estratégico
- Sinais falsos frequentes podem ocorrer em mercados voláteis
- A correlação de risco/benefício fixo pode não ser adequada para captar uma forte tendência
- A exigência rigorosa de três linhas K consecutivas pode perder algumas oportunidades potenciais.
- O ponto de parada é definido no limite da linha K do sinal, que pode estar muito longe quando há uma grande oscilação
Recomenda-se que os riscos sejam gerenciados da seguinte forma:
- Parâmetros de correção de bandas de Bryn combinados com os ciclos de flutuação do mercado
- Risco-benefício ajustado à dinâmica das características do mercado
- Adicionar indicadores de confirmação de tendência
- Optimizar o método de configuração do ponto de parada
Direção de otimização da estratégia
- Parâmetros de otimização:
- O ciclo de Brin e o múltiplo do diferencial padrão podem ser ajustados de acordo com a dinâmica de diferentes características do mercado
- Considere transformar a exigência de três linhas K em um julgamento dinâmico
- Otimização de sinal:
- Aumentar os indicadores de confirmação de tendência como o ADX ou a linha de tendência
- Introdução de um mecanismo de confirmação de entrega
- Considere a inclusão de indicadores de oscilação como auxiliares
- Optimização da gestão de posições:
- Configurações de risco-benefício para a realização de dinâmicas
- Adição de módulo de gestão de fundos
- Considerando o mecanismo de construção de depósitos em lotes
- Optimização de Stop Loss:
- Introdução de mecanismos de rastreamento de perdas
- Distância de parada baseada em ATR
- Considere a perda de tempo
Resumir
Trata-se de uma estratégia de acompanhamento de tendências com uma estrutura completa e lógica clara. O mecanismo de confirmação múltipla da forma de breakout de Brin e de linhas de fusão reduz efetivamente o risco de falsos sinais. A configuração de risco-recompensa fixa simplifica a administração de transações, mas também limita a flexibilidade da estratégia.
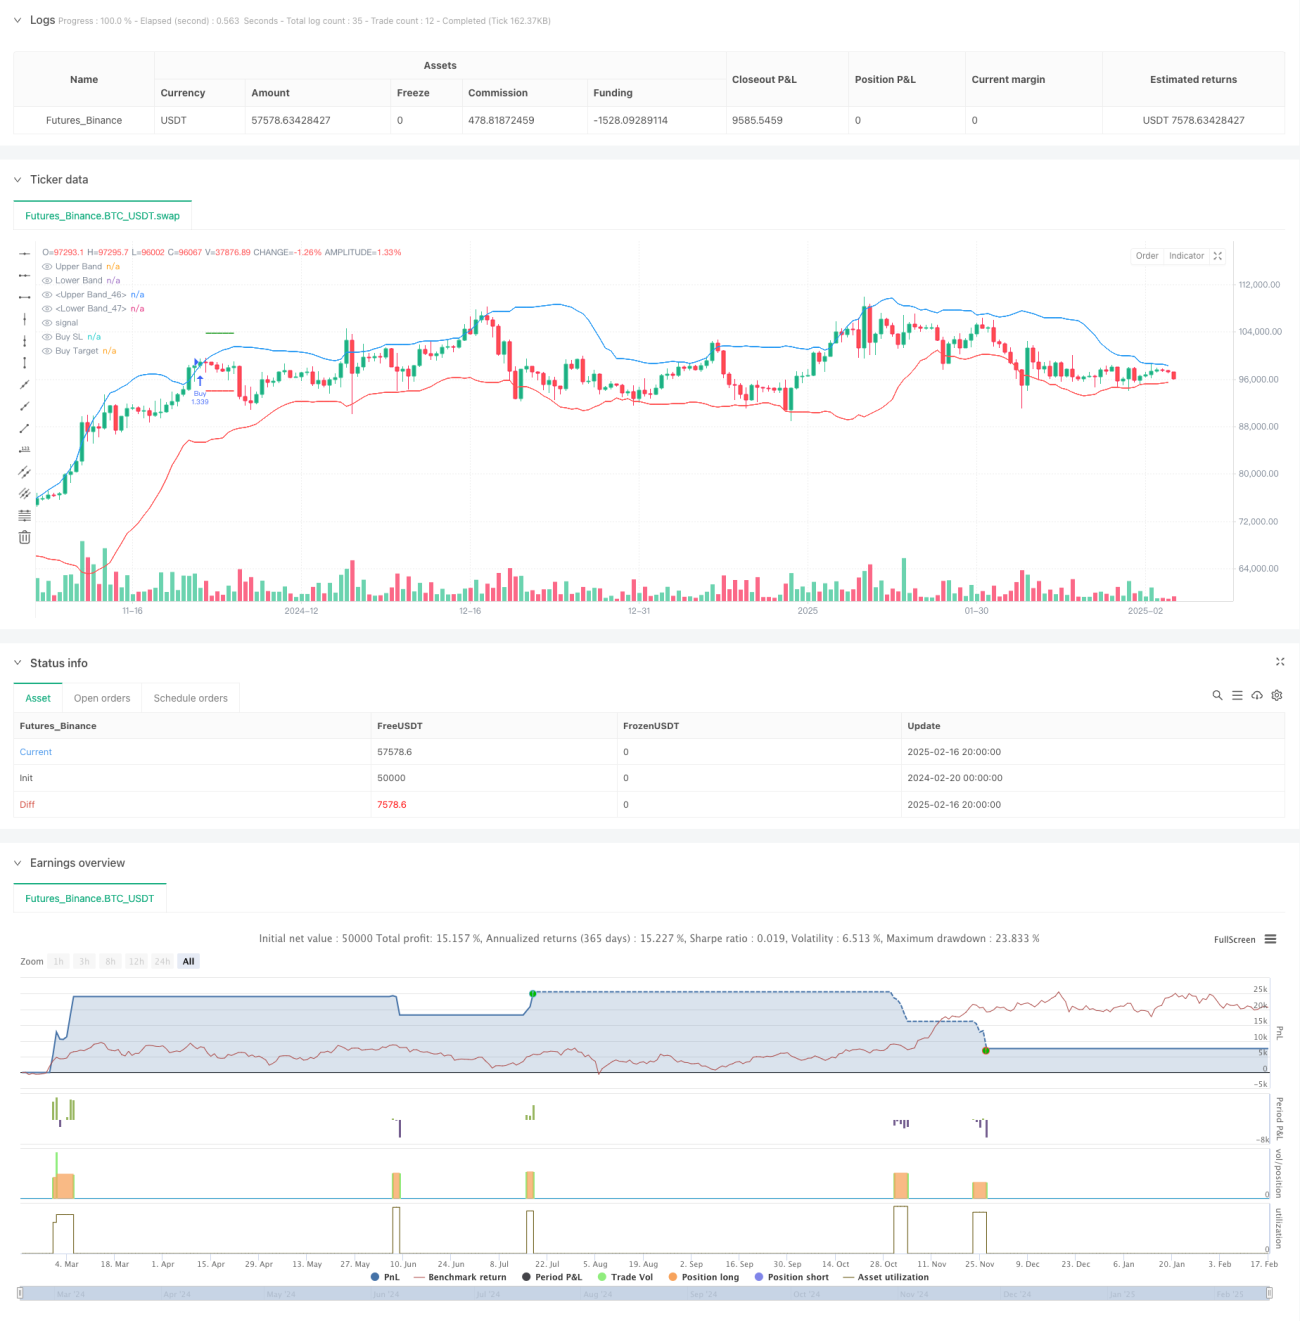
/*backtest
start: 2024-02-20 00:00:00
end: 2025-02-17 08:00:00
period: 12h
basePeriod: 12h
exchanges: [{"eid":"Futures_Binance","currency":"BTC_USDT"}]
*/

//@version=6
strategy("Bollinger Band Strategy (Close Near High/Low Relative to Half Range)", overlay=true, default_qty_type=strategy.percent_of_equity, default_qty_value=200, pyramiding=0)

// Bollinger Bands- 1