Estratégia de acompanhamento de tendência dinâmica de múltiplos períodos combinando indicadores EMA e ADX

Visão geral
Esta estratégia é um sistema de negociação de acompanhamento de tendências que combina a análise de múltiplos prazos e negocia em um período de 15 minutos através da integração de indicadores técnicos como a média móvel do índice (EMA), o índice de tendência médio (ADX) e o índice de fraqueza relativa (RSI). A estratégia usa uma abordagem conservadora de gerenciamento de posição, com o risco de cada transação controlado em menos de 2% do total da conta para obter um retorno estável a longo prazo.
Princípio da estratégia
A estratégia usa um cruzamento de EMAs rápidas (de 50 ciclos) e lentas (de 200 ciclos) para identificar a direção da tendência e, em combinação com o indicador ADX, para confirmar a força da tendência. Quando o valor do ADX é maior que 25, o mercado está em um estado de forte tendência. O indicador RSI é usado para identificar um estado de sobrevenda e sobrevenda.
Vantagens estratégicas
- A integração de múltiplos indicadores técnicos reduziu o impacto de sinais falsos e aumentou a confiabilidade das transações.
- A configuração de stop-loss é dinâmica e pode ser ajustada de acordo com as flutuações do mercado.
- A estratégia de gestão de posição conservadora (controle de risco de 2%) reduziu o risco de retração.
- A análise de múltiplos prazos fornece uma visão mais abrangente das tendências do mercado.
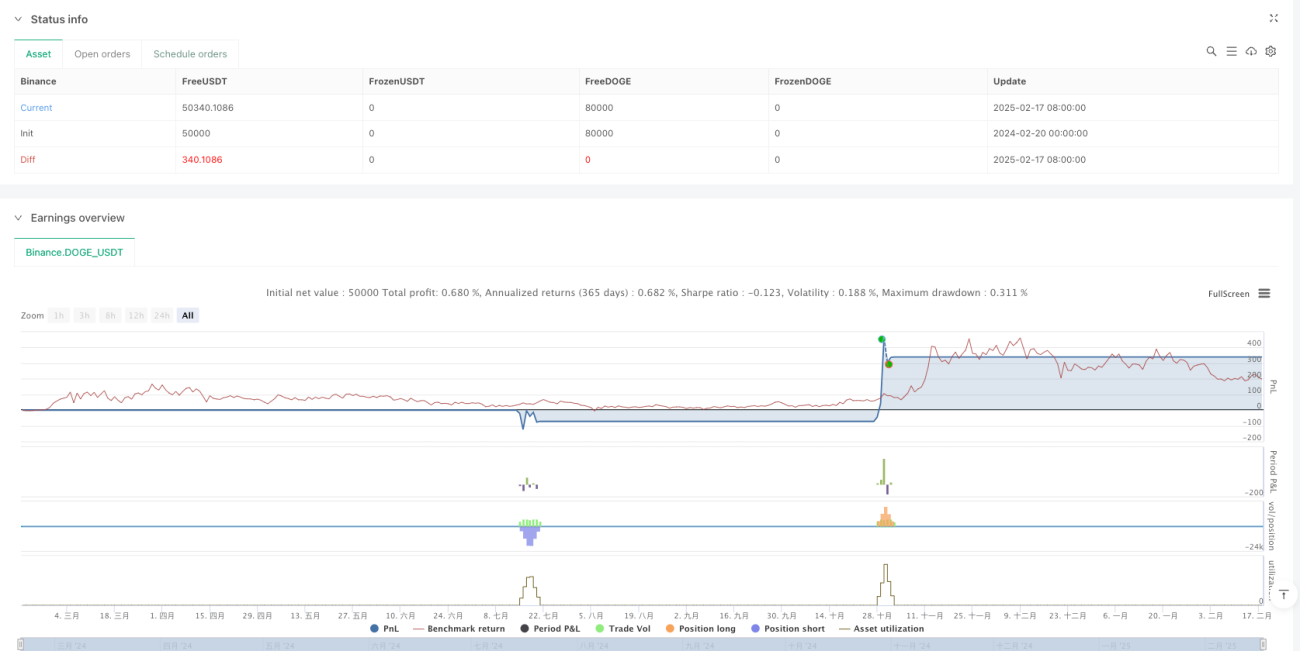
- A retrospectiva da estratégia mostra uma taxa de vitória de 62,86% e um fator de lucro de 1,136.
Risco estratégico
- A frequência de sinais de negociação em mercados turbulentos pode aumentar os custos de negociação.
- A estratégia de cruzamento da EMA pode ser retardada em uma rápida reversão.
- O excesso de dependência de indicadores técnicos pode ignorar os efeitos de fatores fundamentais.
- Os limites fixos de ADX podem ser inconsistentes em diferentes cenários de mercado.
Direção de otimização da estratégia
- A introdução de indicadores de taxa de flutuação (como ATR) para ajustar dinamicamente o nível de stop-loss.
- Considere a inclusão de um indicador de volume de transação como uma confirmação complementar do sinal de transação.
- Desenvolver um sistema de margem ADX adaptável para diferentes cenários de mercado.
- Adição de indicadores de sentimento de mercado para melhorar a precisão da hora de entrada.
- Optimizar a seleção de ciclos em múltiplos períodos de tempo, procurando a combinação ideal.
Resumir
A estratégia mostra um bom potencial de negociação através de métodos multidimensionais de análise técnica e rigorosos controles de risco. Embora tenha um desempenho estável na retrospectiva, a estratégia ainda precisa ser plenamente verificada em um ambiente real. O design modular da estratégia permite uma maior adaptabilidade e espaço de otimização, que pode ser ajustado de forma flexível de acordo com as mudanças no mercado.
- 1