Visão geral
A estratégia é um sistema de negociação de acompanhamento de tendências que combina vários indicadores técnicos. Baseia-se principalmente em sinais de cruzamento de médias móveis simples (SMA) e médias móveis indexadas (EMA) e integra várias características avançadas, como a faixa de tendência das médias móveis de Hull (HMA), o indicador William (%R) e a análise de pontos altos e baixos oscilantes, para fornecer sinais de negociação mais confiáveis por meio de mecanismos de filtragem dinâmica.
Princípio da estratégia
A lógica central da estratégia baseia-se nos seguintes elementos-chave:
- Usando o SMA de 100 e o EMA de 200 como principais indicadores de tendências
- A banda de tendência HMA de 70 ciclos integrados é usada para confirmar a dinâmica da tendência
- Calculação de suporte dinâmico/resistência usando o indicador de William ((%R)
- Detecção de alta e baixa oscilação através de uma janela de retrocesso de 20 ciclos
- Monitoramento e atualização em tempo real
- Configure o filtro inicial da abertura e o limiar de flutuação de ± 0,5% para reduzir o sinal falso
As condições de entrada devem ser atendidas ao mesmo tempo: linha de média dupla na estação de preço, indicador% R com 3 linhas K sucessivas e maiores que -20, linha de K fechada e preço de fechamento acima da linha anterior, o preço não excede o limiar de flutuação do dia. A condição de saída deve satisfazer uma das seguintes condições: preço abaixo da linha média dupla; índice %R abaixo de -80;
Vantagens estratégicas
- A validação sincronizada de múltiplos indicadores técnicos aumenta a confiabilidade dos sinais de transação
- Mecanismo de filtragem dinâmica eficaz na redução de sinais falsos em períodos de forte flutuação
- O cálculo do nível de resistência de suporte auto-adaptável torna a estratégia de boa adaptabilidade ao mercado
- Completo mecanismo de gestão de negociação intradiária, incluindo filtragem inicial de abertura e controle de limiar de flutuação
- Parâmetros flexíveis para otimização de acordo com diferentes condições de mercado
Risco estratégico
- Sistemas de equilíbrio linear podem gerar falsos sinais frequentes em mercados de turbulência
- Filtragem com múltiplos critérios pode fazer com que você perca algumas oportunidades de negócios em potencial
- O ciclo de uma média móvel fixa pode variar em diferentes cenários de mercado
- O mecanismo de filtragem de transações intra-dia pode perder uma oportunidade importante em um cenário de tendências rápidas
- A otimização excessiva dos parâmetros pode causar problemas de sobreajuste
Direção de otimização da estratégia
- A introdução de um mecanismo de cálculo de ciclo medido linear auto-adaptável permite que o sistema se adapte melhor às flutuações do mercado
- Aumentar os indicadores de análise de volume de transações para aumentar a confiabilidade da confirmação de tendências
- Desenvolvimento de mecanismos de suspensão de prejuízos dinâmicos e melhoria da eficiência da gestão de fundos
- Adição de um indicador de volatilidade de mercado para otimizar a configuração de barreiras de filtragem
- Considerar a sincronia de sinais em diferentes períodos de tempo, aumentando a estabilidade do sistema
Resumir
Trata-se de um sistema de negociação de acompanhamento de tendências bem projetado, que mantém uma boa flexibilidade, garantindo a confiabilidade, através da combinação de vários indicadores técnicos e um mecanismo de filtragem rigoroso. O espaço de otimização da estratégia reside principalmente na auto-adaptabilidade dos parâmetros e na melhoria do mecanismo de gerenciamento de risco.
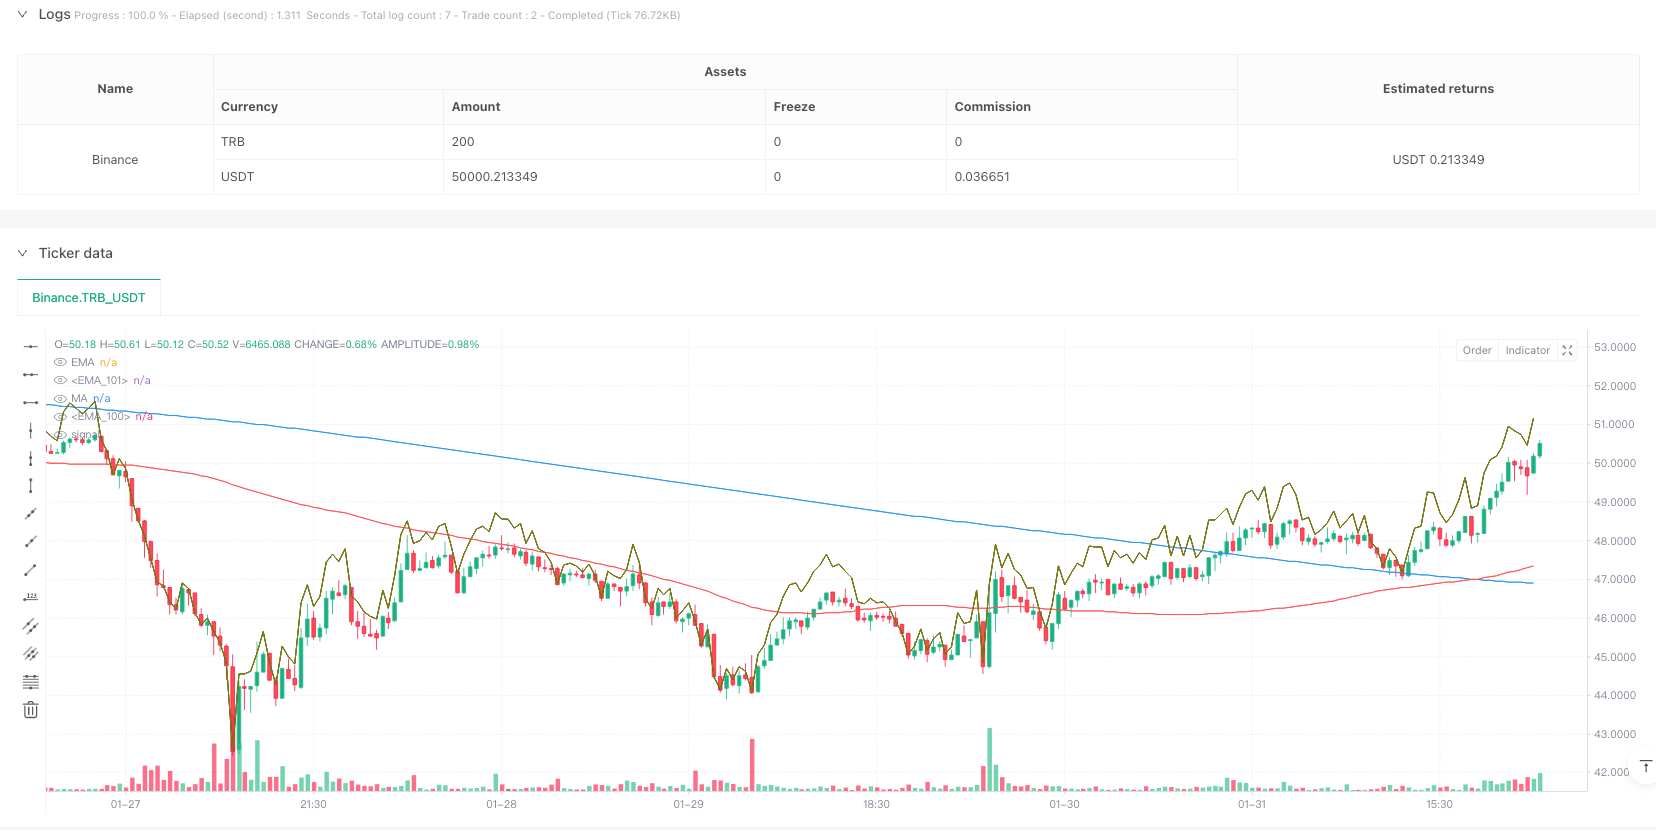
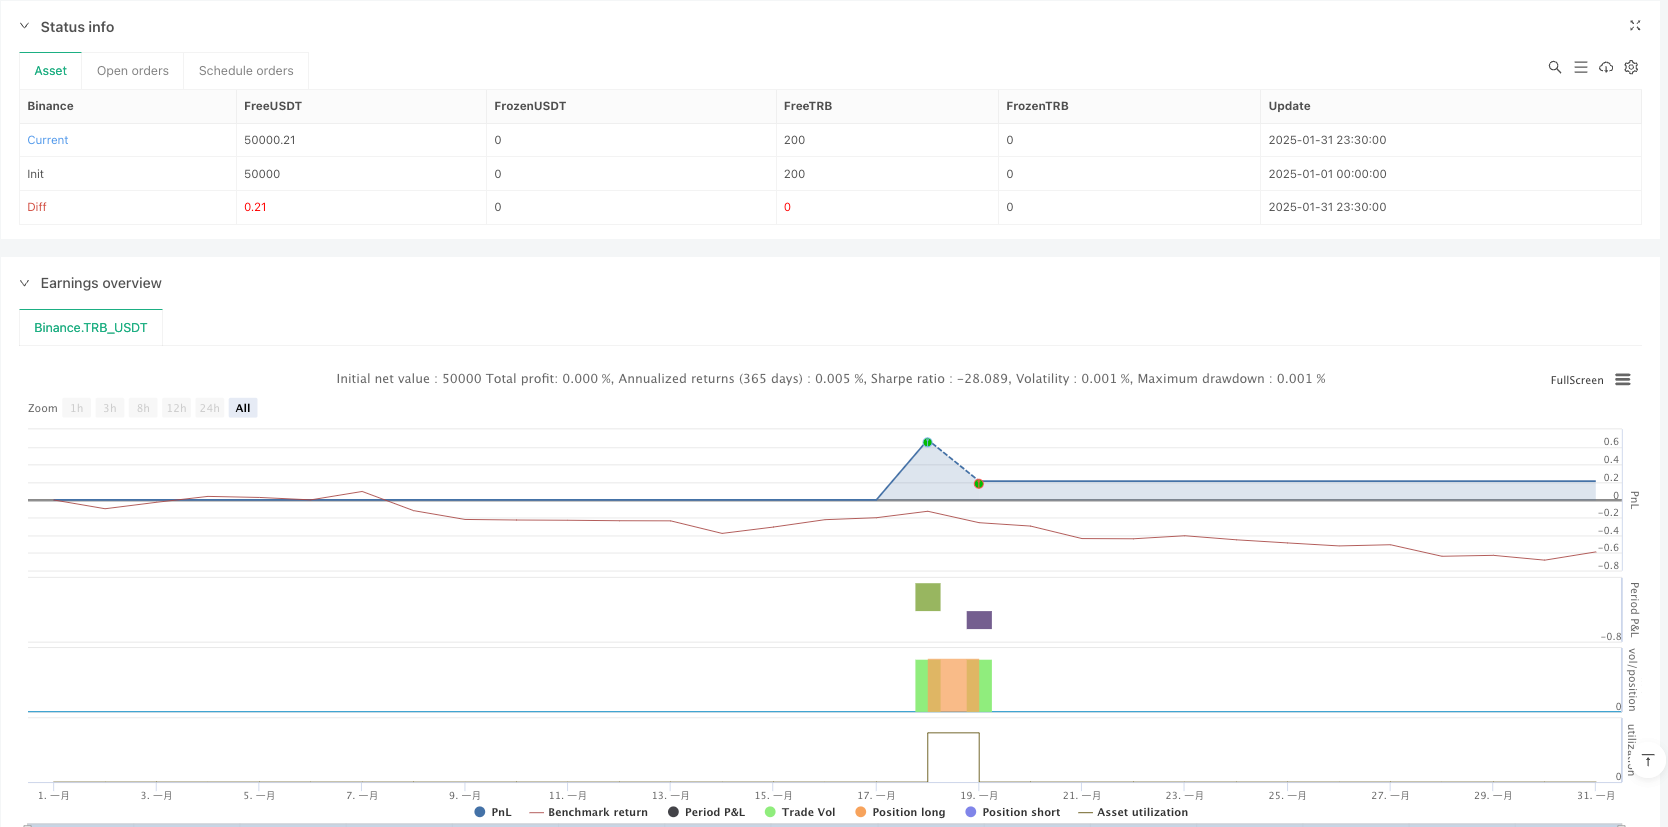
/*backtest
start: 2025-01-01 00:00:00
end: 2025-01-31 23:59:59
period: 30m
basePeriod: 30m
exchanges: [{"eid":"Binance","currency":"TRB_USDT"}]
*/

//@version=5
strategy(title="EMA & MA Crossover Strategy", shorttitle="EMA & MA Crossover Strategy", overlay=true)

// Inputs
LengthMA = input.int(100, minval=1, title="MA Length")
LengthEMA = input.int(200, minval=1, title="EMA Length")
swingLookback = input.int(20, title="Swing Lookback")
Lengthhmaribbon = input.int(70, minval=1, title="HMA Ribbon")
// Input for ignoring the first `n` candles of the day
ignore_n_candles = input.int(1, "Ignore First N Candles", minval=0)
// Input for percentage threshold to ignore high run-up candles
run_up_threshold = input.float(0.5, "Run-up Threshold (%)", minval=0.0)

//====================================================================
hmacondition = ta.hma(close,Lengthhmaribbon)> ta.hma(close,Lengthhmaribbon)[1]

//====================================================================
// Function to drop the first `n` candles
dropn(src, n) =>
    na(src[n]) ? na : src

// Request data with the first `n` candles dropped
valid_candle = not na(dropn(close, ignore_n_candles))
// Check for run-up condition on the previous candle
prev_run_up = (high[1] - low[1]) / low[1] * 100

// Combine conditions: exclude invalid candles and ignore high run-up candles
valid_entry_condition = valid_candle and prev_run_up <= run_up_threshold

//======================================================
// Define the start of a new day based on time
var is_first = false
var float day_high = na
var float day_low = na

// Use time() to detect the start of a new day
t = time("1440") // 1440 = 60 * 24 (one full day in minutes)
is_first := na(t[1]) and not na(t) or t[1] < t

if is_first and barstate.isnew
    day_high := high
    day_low := low
else
    day_high := nz(day_high[1], high)
    day_low := nz(day_low[1], low)

// Update daily high and low
if high > day_high
    day_high := high

if low < day_low
    day_low := low

//====================================================
previousdayclose = request.security(syminfo.tickerid, "D", close)

day_highrange = previousdayclose*.018
//======================================================
length = input(title="Length", defval=14)
src = input(close, "Source")
_pr(length) =>
	max = ta.highest(length)
	min = ta.lowest(length)
	100 * (src - max) / (max - min)
percentR = _pr(length)

//======================================================
higherline = close* 1+((100-(percentR*-1))/100)
lowerline = close* 1-((100-(percentR*-1))/100)
//======================================================
// Moving Averages
xMA = ta.sma(close, LengthMA)
xEMA = ta.sma(xMA, LengthEMA)

// Plot the MA and EMA lines
plot(xMA, color=color.red, title="MA")
plot(xEMA, color=color.blue, title="EMA")

// Find recent swing high and low
recentHigh = ta.highest(high, swingLookback)
recentLow = ta.lowest(low, swingLookback)
//===============================================
emacondition = ta.ema(close,20)>ta.ema(close,30) and ta.ema(close,30)>ta.ema(close,40) and ta.ema(close,40)>ta.ema(close,50) and close >ta.ema(close,20)
// Define Buy Condition
buyCondition1 = (percentR>percentR[1] and percentR[1]>percentR[2] and percentR[2]>percentR[3]) and percentR>-20 and percentR[1]>-20
buyCondition = (close> xMA and close> xEMA) and (close > open and close > close[1]) or xMA>xEMA and close<day_highrange and hmacondition and emacondition

// Define Sell Conditions
sellCondition = (close < xMA and close < xEMA) or xMA<xEMA or percentR<-80

// Strategy Execution
if (buyCondition and buyCondition1 and valid_entry_condition)
    strategy.entry("Buy", strategy.long)

if (sellCondition)
    strategy.close("Buy")  // Close the long position

// Candle coloring for buy/sell indication
barcolor(buyCondition ? color.green : sellCondition ? color.red : na)
plot(higherline, color=color.olive, title="EMA")
plot(higherline, color=color.black, title="EMA")