Visão geral
A estratégia é um sistema de negociação integrado, baseado em análise técnica, que combina áreas de resistência de suporte, configurações de gráficos e análise da estrutura do mercado. A estratégia toma decisões de negociação através da identificação de níveis críticos de preços, confirmação de sinais de gráficos e avaliação de tendências globais do mercado.
Princípio da estratégia
A lógica central da estratégia baseia-se nos seguintes componentes-chave:
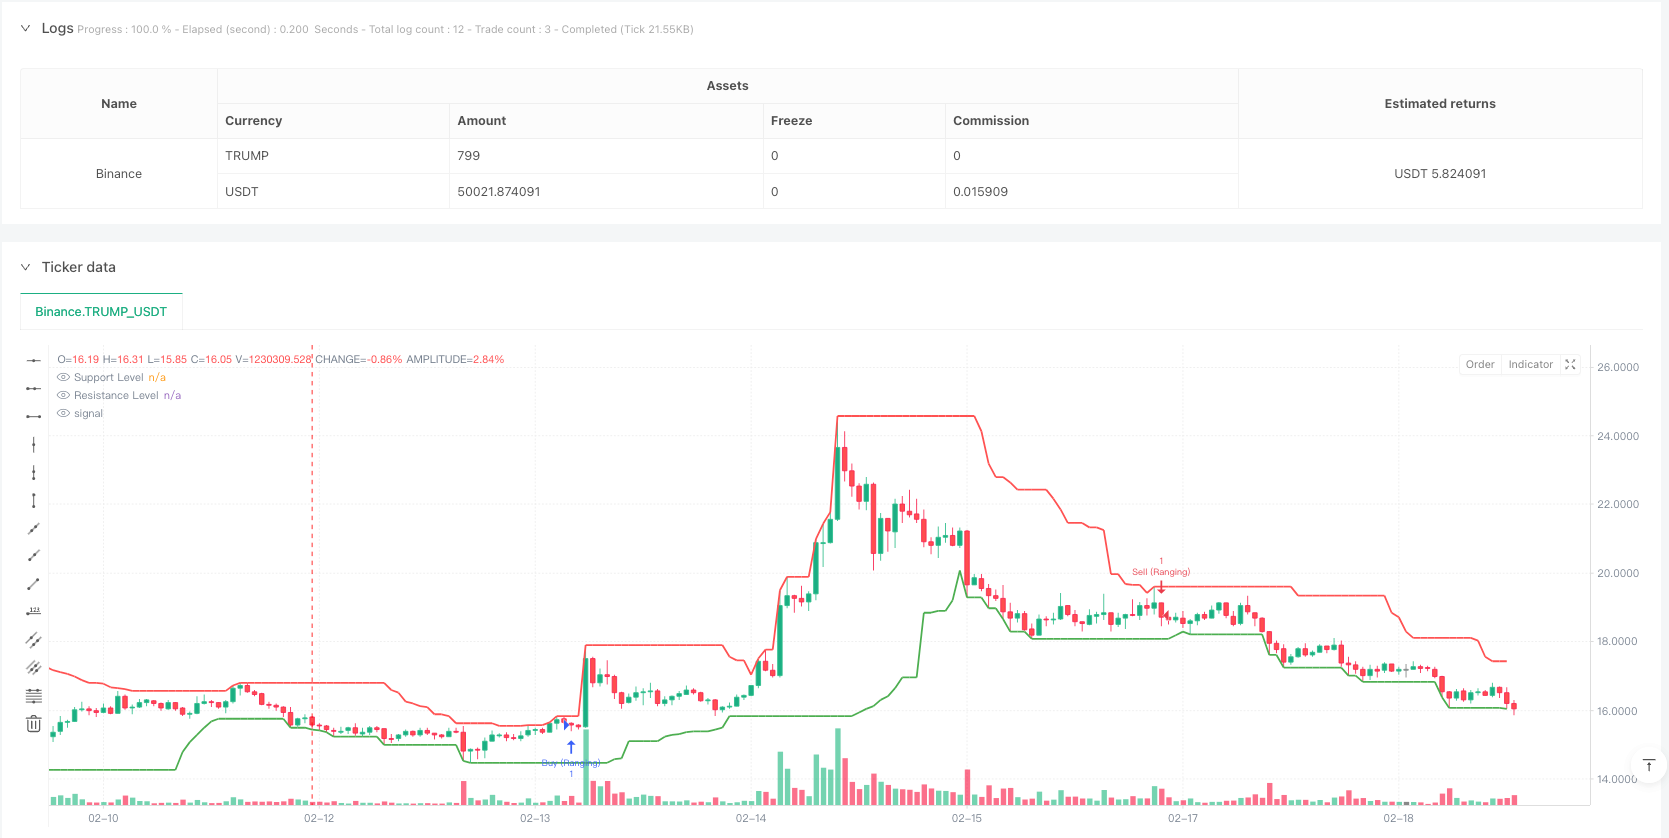
- Identificação de áreas de resistência de suporte - usando os máximos e mínimos dos últimos 20 ciclos para determinar os níveis críticos de preços
- Confirmação de configurações do gráfico - incluindo configurações típicas como engulfamento de bullish, engulfamento de bearish, linha de cone e linha de meteoro
- Análise da estrutura do mercado - determina se o mercado está em uma tendência ascendente, descendente ou com oscilações intercalares, comparando uma sequência de altos e baixos
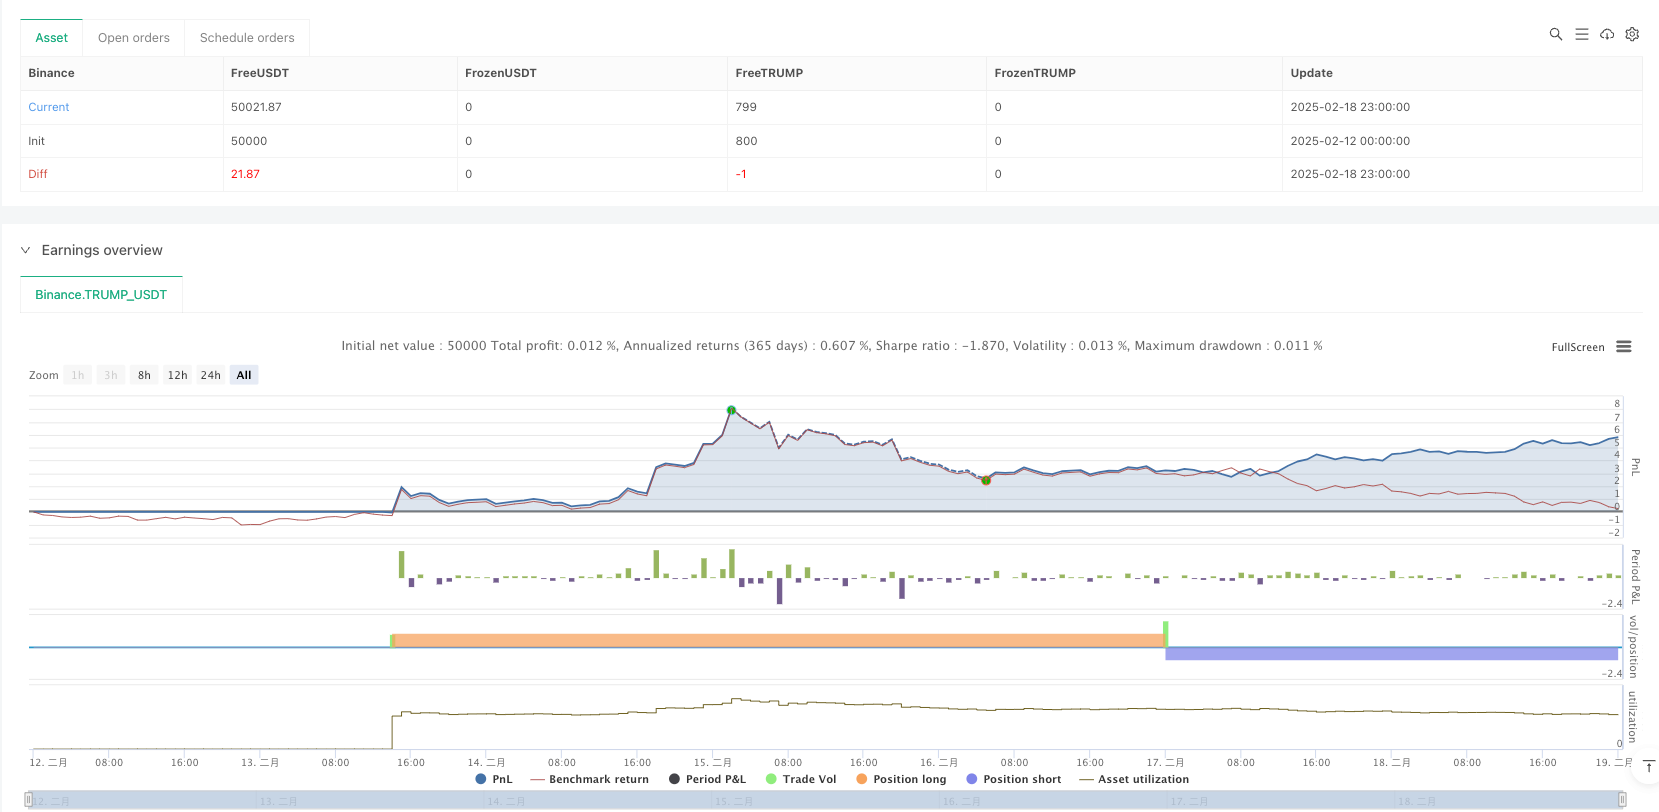
- Gerenciamento de risco - configuração de posições de parada com um número fixo de pontos de parada e uma relação de risco/benefício de 1:3
A estratégia funciona em três ambientes de mercado: mercado de tendência, mercado intermédio e mercado de giro, mas com um conjunto diferente de regras de negociação para cada ambiente.
Vantagens estratégicas
- Análise multidimensional - fornece sinais de negociação mais confiáveis através da integração de níveis de preços, gráficos e estrutura de mercado
- Adaptabilidade - capacidade de se adaptar a diferentes cenários de mercado, incluindo tendências e intervalos
- Gestão de risco perfeita - uso de um risco-benefício fixo para garantir que cada transação tenha um controle de risco claro
- Suporte de visualização - áreas de resistência apoiadas por marcadores gráficos para ajudar os comerciantes a entender o estado do mercado
Risco estratégico
- Risco de Falso Breakout - o preço pode retroceder rapidamente após a ruptura, gerando um falso sinal
- Risco de deslizamento - os preços reais de transação podem estar mais distantes dos esperados em períodos de alta volatilidade
- Sensibilidade de parâmetros - a escolha de parâmetros de suporte, como o ciclo de resistência e o ciclo de estrutura de mercado, pode afetar significativamente a performance da estratégia
- Dependência do cenário de mercado - pode ter um desempenho fraco em mercados rápidos ou de forte volatilidade
Direção de otimização da estratégia
- Ajuste de parâmetros dinâmicos - ciclo de cálculo de áreas de resistência de suporte ajustadas automaticamente de acordo com a volatilidade do mercado
- Aumento do filtro - adição de indicadores como volume de tráfego, taxa de flutuação para filtrar falsos sinais de ruptura
- Optimização de stop loss - implementação de configurações de stop loss dinâmicas baseadas em ATR para melhorar a adaptabilidade às flutuações do mercado
- Verificação de quadros horários - introdução de análise de múltiplos quadros horários para aumentar a confiabilidade do sinal
- Optimização da gestão de posições - ajuste dinâmico do tamanho das posições em função da volatilidade do mercado e da intensidade dos sinais
Resumir
A estratégia, através da aplicação integrada de várias ferramentas de análise técnica, constrói um sistema de negociação completo. Sua vantagem reside na análise multidimensional e na gestão de riscos perfeita, mas também enfrenta desafios como brechas falsas e sensibilidade a parâmetros. Através da orientação de otimização recomendada, a estratégia espera aumentar ainda mais a estabilidade e a adaptabilidade, mantendo a base das vantagens existentes.
/*backtest
start: 2025-02-12 00:00:00
end: 2025-02-19 00:00:00
period: 1h
basePeriod: 1h
exchanges: [{"eid":"Binance","currency":"TRUMP_USDT"}]
*/

//@version=5
strategy("Support/Resistance Strategy with Candlestick Confirmation, Market Structure, and 1:3 R:R", overlay=true)

// Input parameters
supportResistancePeriod = input.int(20, title="Support/Resistance Period", minval=1)
stopLossPips = input.int(50, title="Stop Loss (in pips)", minval=1)
takeProfitRatio = input.float(3.0, title="Risk-to-Reward Ratio", minval=1.0)
structurePeriod = input.int(20, title="Market Structure Period", minval=1)  // Period to determine market structure

// Function to calculate support level (lowest low in the period)
getSupportLevel() =>
    ta.lowest(low, supportResistancePeriod)

// Function to calculate resistance level (highest high in the period)
getResistanceLevel() =>
    ta.highest(high, supportResistancePeriod)

// Get the support and resistance levels
supportLevel = getSupportLevel()
resistanceLevel = getResistanceLevel()

// Function to detect market structure
isBullishTrend() =>
    high[structurePeriod] > high[structurePeriod+1] and low[structurePeriod] > low[structurePeriod+1]

isBearishTrend() =>
    high[structurePeriod] < high[structurePeriod+1] and low[structurePeriod] < low[structurePeriod+1]

isRanging() =>
    not isBullishTrend() and not isBearishTrend()

// Candlestick Pattern Detection Functions
isBullishEngulfing() =>
    close[1] < open[1] and close > open and close > open[1] and open < close[1]

isBearishEngulfing() =>
    close[1] > open[1] and close < open and close < open[1] and open > close[1]

isDoji() =>
    math.abs(close - open) <= (high - low) * 0.1

isHammer() =>
    body = math.abs(close - open)
    upperShadow = high - math.max(close, open)
    lowerShadow = math.min(close, open) - low
    body <= (high - low) * 0.3 and lowerShadow > body * 2 and upperShadow <= body * 0.5

isShootingStar() =>
    body = math.abs(close - open)
    upperShadow = high - math.max(close, open)
    lowerShadow = math.min(close, open) - low
    body <= (high - low) * 0.3 and upperShadow > body * 2 and lowerShadow <= body * 0.5

// Conditions for Buy and Sell based on candle close
buyCondition = (isBullishEngulfing() or isHammer()) and close > supportLevel
sellCondition = (isBearishEngulfing() or isShootingStar()) and close < resistanceLevel

// Define buy/sell conditions based on market structure
bullishMarket = isBullishTrend() and buyCondition
bearishMarket = isBearishTrend() and sellCondition
rangingMarket = isRanging() and (buyCondition or sellCondition)

// Calculate the Stop Loss and Take Profit Levels
longStopLoss = supportLevel - (stopLossPips * syminfo.mintick)
shortStopLoss = resistanceLevel + (stopLossPips * syminfo.mintick)

// Calculate R:R based Take Profit Levels
longTakeProfit = close + (math.abs(close - longStopLoss) * takeProfitRatio)
shortTakeProfit = close - (math.abs(close - shortStopLoss) * takeProfitRatio)

// Plotting Support and Resistance Lines
plot(supportLevel, color=color.green, linewidth=2, title="Support Level", style=plot.style_line)
plot(resistanceLevel, color=color.red, linewidth=2, title="Resistance Level", style=plot.style_line)

// Strategy: Buy on Support, Sell on Resistance with candlestick confirmation and market structure
if (bullishMarket)
    strategy.entry("Buy", strategy.long, stop=longStopLoss, limit=longTakeProfit)

if (bearishMarket)
    strategy.entry("Sell", strategy.short, stop=shortStopLoss, limit=shortTakeProfit)

if (rangingMarket)
    if (buyCondition)
        strategy.entry("Buy (Ranging)", strategy.long, stop=longStopLoss, limit=longTakeProfit)
    if (sellCondition)
        strategy.entry("Sell (Ranging)", strategy.short, stop=shortStopLoss, limit=shortTakeProfit)

// Optional: Highlighting the zones for support and resistance
bgcolor(close > resistanceLevel ? color.new(color.red, 90) : na, title="Resistance Zone")
bgcolor(close < supportLevel ? color.new(color.green, 90) : na, title="Support Zone")