Estratégia de negociação de indicador duplo SuperTrend-Stochastic com Momentum Enhanced

Visão geral
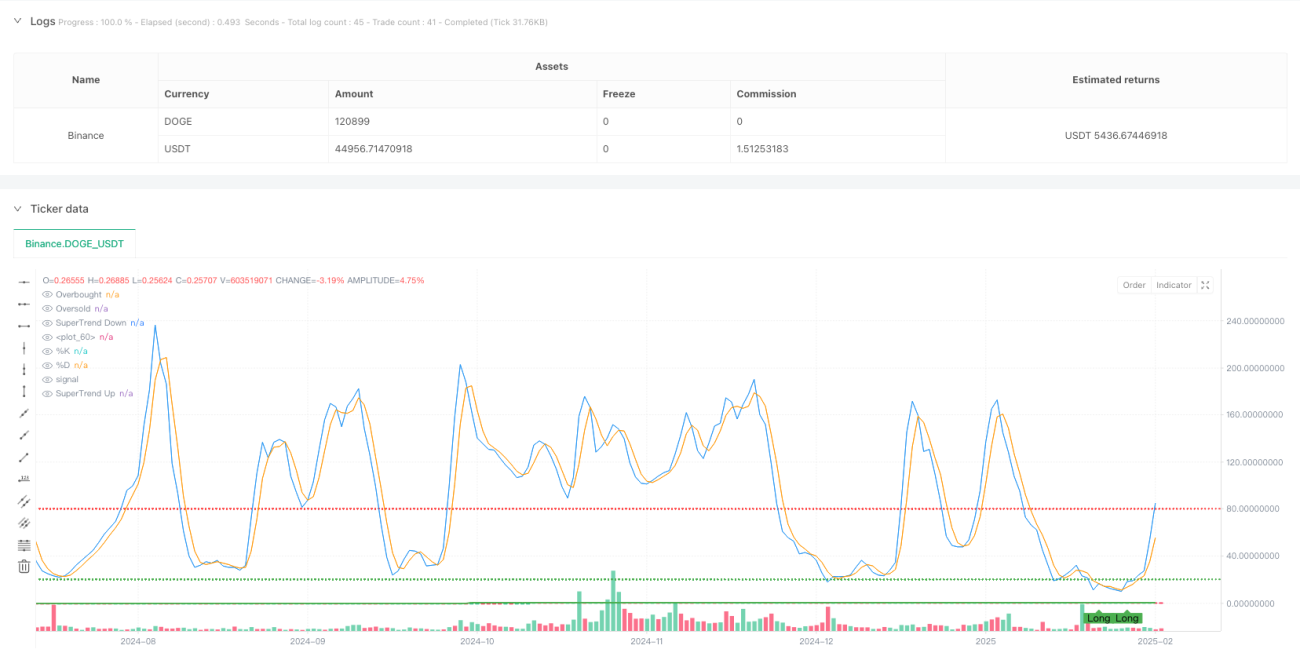
Trata-se de uma estratégia de negociação complexa que combina o indicador de tendência super (SuperTrend) e o indicador de oscilação aleatória (Stochastic Oscillator). A estratégia usa o indicador de tendência super (SuperTrend) para identificar a direção da tendência do mercado, enquanto o indicador de oscilação aleatória é usado para confirmar a dinâmica dos preços, permitindo uma geração de sinais de negociação mais precisa. A estratégia usa o ATR (true amplitude median) como referência de volatilidade, para acompanhar a tendência, ajustando dinamicamente os pontos de suporte / resistência.
Princípio da estratégia
A lógica central da estratégia baseia-se nos seguintes componentes-chave:
- O indicador SuperTrend utiliza o ATR de 10 ciclos e um multiplicador de 3,0 para calcular o canal de resistência de suporte dinâmico
- O indicador de oscilação aleatória usa a configuração de parâmetros clássicos ([14,3,3]) para identificar áreas de sobrecompra e sobrevenda
- "Não é uma questão de tempo.
- SuperTrend indica tendência de alta
- Indicador aleatório %K na linha %D
- % Valor de K em zona de sobrevenda (< 20)
- Requisitos de vaga:
- SuperTrend indica uma tendência de baixa
- Indicador aleatório %K atravessa a linha %D
- %K está na zona de sobrecompra ((mais de 80))
Vantagens estratégicas
- Combinação de rastreamento de tendências e confirmação de dinâmica, aumentando significativamente a confiabilidade dos sinais de negociação
- Adaptação da largura do canal SuperTrend para melhor adaptar-se às flutuações do mercado com o uso do ATR
- Filtração de sobrevenda e sobrecompra de indicadores aleatórios para evitar negociações contractuais em zonas extremas
- Condições de sinal são rigorosas, pode filtrar efetivamente a falsa penetração, reduzir o falso sinal
- Estratégias com lógica clara e com parâmetros ajustáveis para diferentes cenários de mercado
Risco estratégico
- Os sinais de negociação podem ser excessivos em mercados turbulentos, aumentando os custos de negociação.
- As condições de sinalização são muito rigorosas e podem ter perdido algumas oportunidades de negociação em potencial.
- Indicadores de SuperTrend podem ficar para trás em situações de alta volatilidade
- Indicadores aleatórios podem sinalizar uma reversão prematura em mercados de forte tendência
Recomenda-se a adoção das seguintes medidas de controlo de riscos:
- Estabeleça um parâmetro de parada razoável
- Considere aumentar o filtro de intensidade de tendência (como o ADX)
- Parâmetros de ajuste à dinâmica do mercado
Direção de otimização da estratégia
- A introdução de indicadores de intensidade de tendência (como o ADX) para otimizar filtros de negociação:
- Só abrir uma posição quando a tendência é clara
- A frequência de transações evita o choque do mercado
- Parâmetros de otimização de indicadores aleatórios:
- Considerar um ciclo de adaptação
- Ajustado à dinâmica da taxa de flutuação
- Melhorar o sistema de gestão de fundos:
- Posição de parada dinâmica baseada em ATR
- Ajustes dinâmicos para atingir os objetivos de lucro
- Adição de filtro de tempo:
- Evite períodos de baixa mobilidade
- Suspensão de transações antes da divulgação de dados importantes
Resumir
A estratégia, em combinação com a SuperTrend e o indicador de oscilação aleatória, realiza uma combinação orgânica de acompanhamento de tendências e confirmação de dinâmica. A estratégia é projetada de forma razoável, com boa ajustabilidade e adaptabilidade.
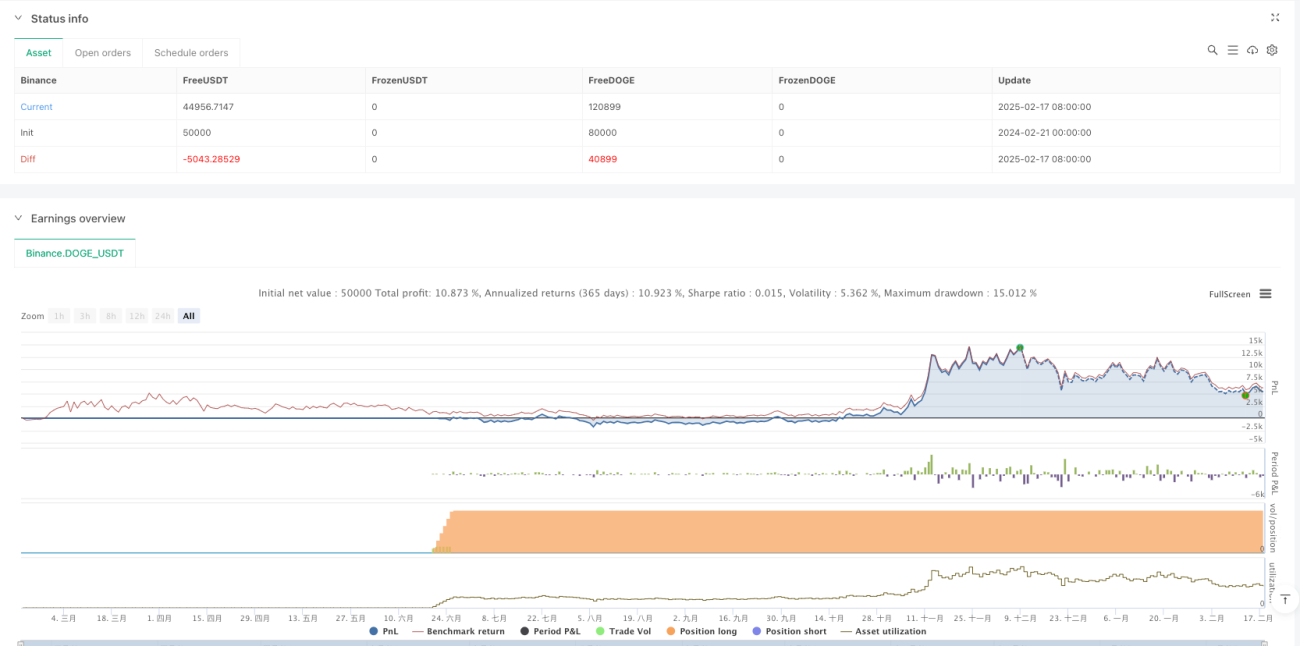
/*backtest
start: 2024-02-21 00:00:00
end: 2025-02-18 08:00:00
period: 1d
basePeriod: 1d
exchanges: [{"eid":"Binance","currency":"DOGE_USDT"}]
*/

//@version=5
strategy("SuperTrend + Stochastic Strategy", overlay=true, default_qty_type=strategy.percent_of_equity, default_qty_value=10)

// === Vstupy ===- 1