
Visão geral
A estratégia é um sistema de negociação que combina sinais de cruzamento de dupla equilíbrio e gerenciamento de risco dinâmico. A estratégia gera sinais de negociação por meio de cruzamentos de médias móveis de curto e longo prazo, ao mesmo tempo em que usa o indicador ATR para ajustar dinamicamente as posições de parada e ganho, e introduz filtragem de tempo e períodos de resfriamento para otimizar a qualidade da negociação.
Princípio da estratégia
A estratégia é baseada nos seguintes componentes principais:
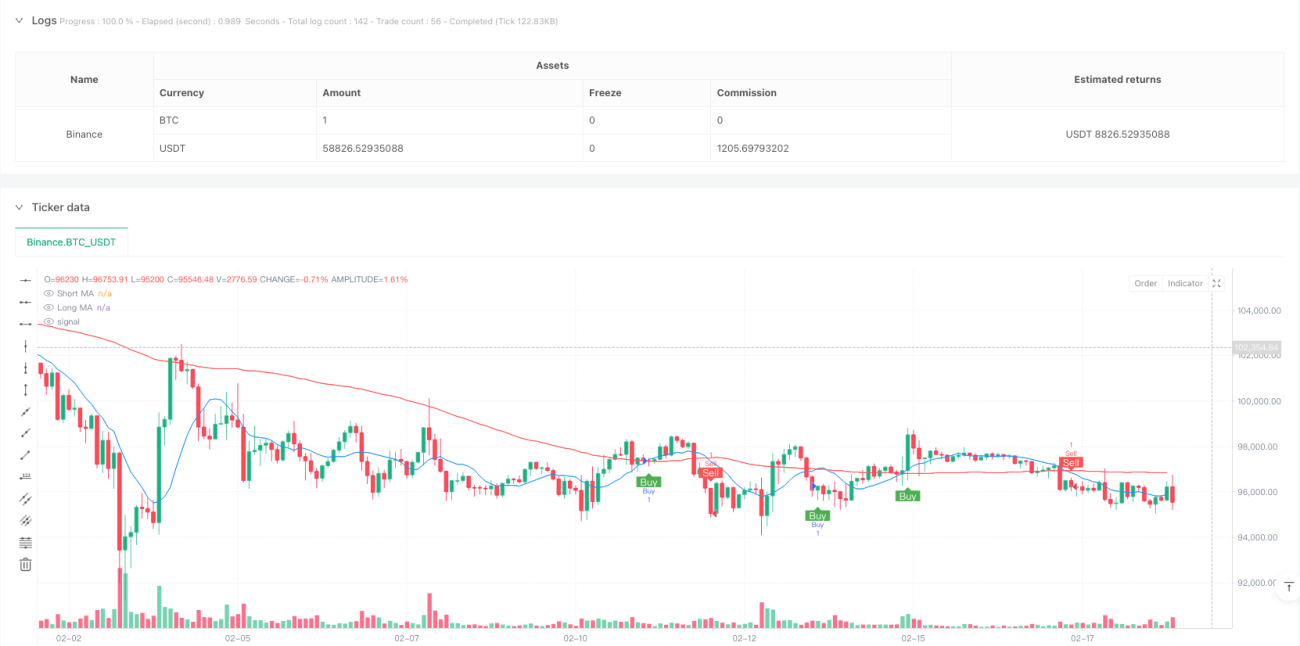
- O sistema de geração de sinais utiliza a interseção de médias móveis simples de curto prazo (de 10 ciclos) e de longo prazo (de 100 ciclos) para desencadear a negociação. Quando a média de curto prazo atravessa a média de longo prazo para cima, gera um sinal de duplo e, ao contrário, um sinal de curto prazo.
- O sistema de gerenciamento de risco usa o ATR de 14 ciclos multiplicado por um factor de 1,5 para definir a distância de parada dinâmica, e o objetivo de lucro é de 2 vezes a distância de parada (RRR ajustável).
- O filtro de tempo permite que o usuário defina um período de tempo específico para a transação, executando a transação apenas dentro do período de tempo especificado.
- O mecanismo de período de arrefecimento de negociação configura um período de espera de 10 ciclos para evitar o excesso de negociação.
- O risco de cada transação é controlado em 1% da conta (podendo ser ajustado).
Vantagens estratégicas
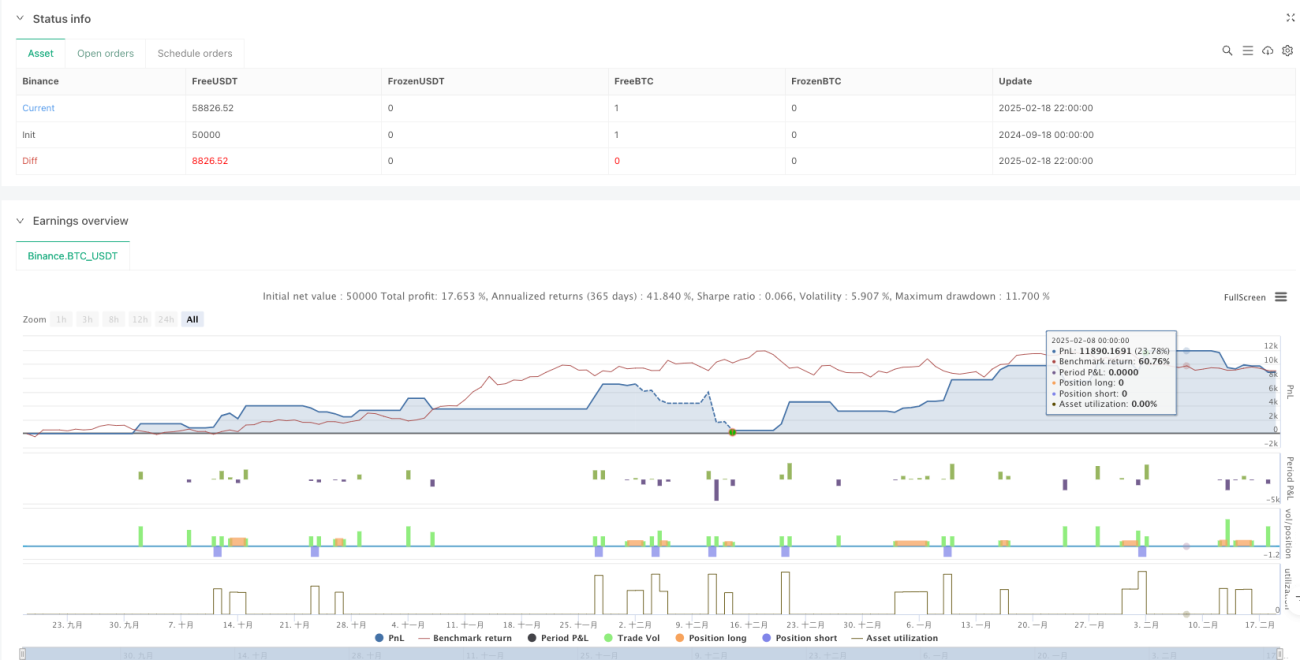
- Gerenciamento de risco dinâmico: Adapta-se à volatilidade do mercado usando o indicador ATR, ajustando automaticamente o intervalo de parada e ganho em diferentes cenários de mercado.
- Controle de risco completo: Realizar uma gestão de fundos sistematizada através da definição da relação risco-recompensa e da proporção de risco por transação.
- Gerenciamento flexível do tempo: o tempo de negociação pode ser ajustado de acordo com as características do horário de negociação de diferentes mercados.
- Prevenção de excesso de negociação: O mecanismo de período de arrefecimento é eficaz para evitar o surgimento de excesso de sinais de negociação em períodos de forte volatilidade.
- Efeito de visualização: mostra sinais de negociação e médias móveis claramente em gráficos para facilitar a análise e otimização.
Risco estratégico
- Risco de reversão de tendência: pode haver falsos sinais de ruptura em mercados turbulentos, resultando em perdas contínuas.
- Sensibilidade de parâmetros: a escolha de parâmetros como o ciclo da média móvel, o múltiplo ATR, etc. pode afetar significativamente o desempenho da estratégia.
- Se o filtro de tempo não for configurado corretamente, você pode perder oportunidades importantes.
- A relação de risco/benefício fixa pode não ser suficientemente flexível em diferentes cenários de mercado.
Direção de otimização da estratégia
- Introdução de filtros de intensidade de tendência: ADX ou indicadores similares podem ser adicionados para julgar a intensidade da tendência, apenas para negociar durante uma forte tendência.
- Dinâmico ajuste de risco-receita: Ajuste automático de risco-receita de acordo com a volatilidade do mercado ou a força da tendência.
- Aumento da análise de volume de transação: o volume de transação é usado como um indicador complementar para a confirmação do sinal.
- Mecanismos para otimizar o período de arrefecimento: o período de arrefecimento pode ser ajustado de acordo com a dinâmica de volatilidade do mercado.
- Adição de classificação de cenários de mercado: diferentes combinações de parâmetros são usadas em diferentes cenários de mercado.
Resumir
A estratégia combina métodos clássicos de análise técnica e modernos conceitos de gerenciamento de risco, construindo um sistema de negociação completo. Sua principal vantagem reside na gestão de risco dinâmica e no mecanismo de filtragem múltipla, mas ainda requer otimização de parâmetros de acordo com as características específicas do mercado em aplicações práticas. O funcionamento bem-sucedido da estratégia requer que o comerciante tenha uma compreensão profunda do papel de cada componente e ajuste os parâmetros em tempo hábil de acordo com as mudanças no mercado.
/*backtest
start: 2024-09-18 00:00:00
end: 2025-02-19 00:00:00
period: 2h
basePeriod: 2h
exchanges: [{"eid":"Binance","currency":"BTC_USDT"}]
*/

//@version=5
strategy("Profitable Moving Average Crossover Strategy", shorttitle="Profitable MA Crossover", overlay=true)

// Input parameters for the moving averages- 1