Bandas de Bollinger Triplas Desvio Padrão Tendência Seguindo Estratégia

Visão geral
A estratégia é um sistema de negociação de acompanhamento de tendências baseado no desvio padrão da faixa de Brin. A estratégia julga a força da tendência observando a relação de posição de três eixos consecutivos em relação ao desvio da faixa de Brin, e negocia quando a tendência é estabelecida. O sistema usa uma relação de risco-benefício fixa para gerenciar o risco de cada transação.
Princípio da estratégia
A lógica central da estratégia baseia-se nos seguintes pontos:
- Usando a média móvel de 20 períodos como a trajectória central da faixa de Bryn e usando o dobro da diferença padrão para calcular a trajectória ascendente e descendente.
- Quando os preços de fechamento de três eixos consecutivos estão acima da linha de alta, o sistema considera que a tendência ascendente já foi estabelecida, fazendo mais entrada quando o terceiro eixo termina.
- Quando os preços de fechamento de três linhas de fecho consecutivos estão abaixo do declínio, o sistema considera que a tendência de queda está estabelecida e entra em aberto no fechamento da terceira linha de fechamento.
- O stop loss é definido como o limite do fio de alumínio no primeiro sinal de entrada.
- O preço-alvo é definido com um risco-benefício de 1:1, ou seja, a distância entre o alvo de ganho e o alvo de perda é igual à distância entre o alvo e o alvo de perda.
Vantagens estratégicas
- O mecanismo de confirmação de sinais é robusto - requer três linhas consecutivas de enlace para quebrar a faixa de Brin, reduzindo efetivamente o risco de falsas brechas.
- Gerenciamento razoável do risco - gerenciamento de transações com uma relação de risco/benefício fixa, evitando perdas excessivas em transações individuais.
- Os efeitos de acompanhamento de tendências são significativos - a característica de desvio padrão da faixa de Bryn permite que a estratégia se adapte às mudanças na volatilidade do mercado.
- As regras de execução são claras - a configuração de metas de entrada, parada e ganho tem padrões de quantificação claros, sem necessidade de julgamento subjetivo.
Risco estratégico
- Mercado horizontal com fraco desempenho - pode gerar frequentes falsos sinais em mercados sem uma tendência óbvia.
- O atraso na admissão - é necessário aguardar a confirmação de três linhas para entrar, podendo perder algumas das etapas iniciais do processo.
- Limitação de um risco-benefício fixo - um risco-benefício de 1:1 pode ser prematuramente concluído em uma forte tendência.
- Falta de filtragem de intensidade de tendência - baseia-se apenas na relação entre o preço e a faixa de Bryn e não considera outros indicadores de confirmação de tendência.
Direção de otimização da estratégia
- Aumento do filtro de intensidade de tendência - indicadores de tendência como ADX ou MACD podem ser introduzidos para melhorar a qualidade do sinal.
- Optimizar a configuração do risco-benefício - o risco-benefício pode ser ajustado de acordo com a volatilidade do mercado.
- Melhorar os mecanismos de parada - Considere aumentar os mecanismos de parada móvel ou de lucro em lotes para melhor entender as grandes tendências.
- Adição de confirmação de volume de transação - aumenta a confirmação de volume de transação na geração de sinais, aumentando a confiabilidade do sinal.
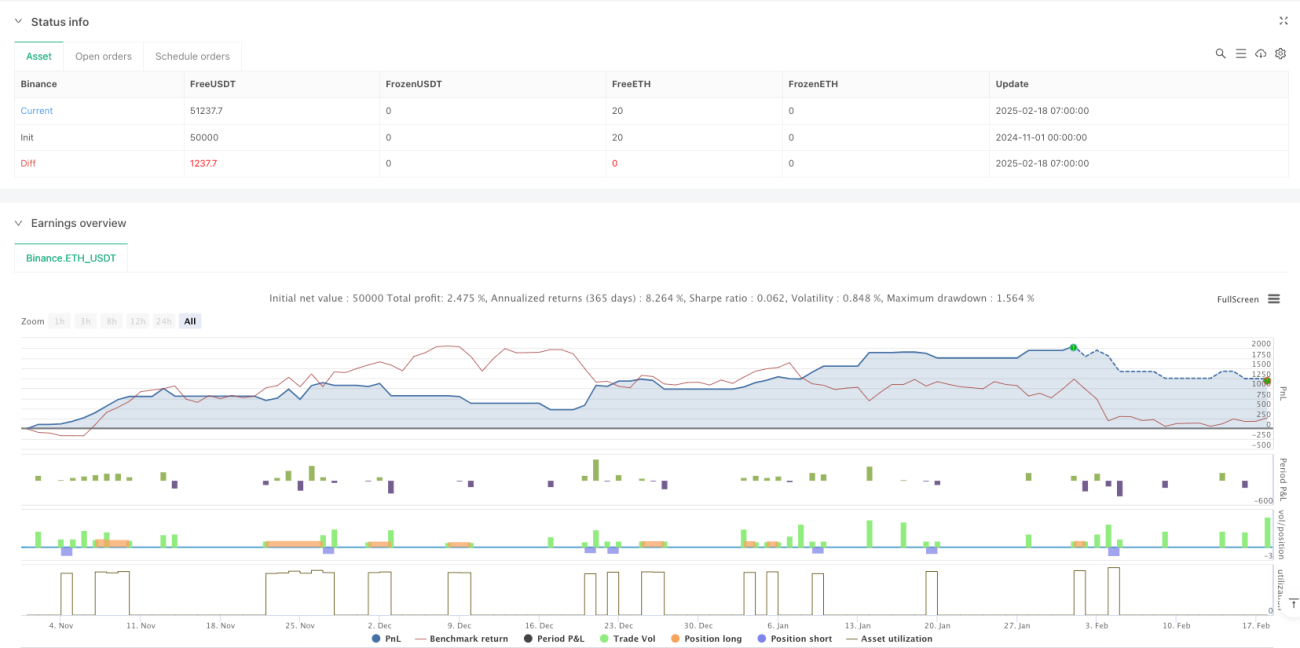
Resumir
Esta é uma estratégia de rastreamento de tendências razoavelmente projetada para capturar as tendências do mercado por meio de correia de Brin e mecanismo de confirmação múltipla. A estrutura de gerenciamento de risco da estratégia é perfeita e os padrões de execução são claros. Embora haja um certo atraso, a estabilidade e a lucratividade da estratégia podem ser melhoradas com a orientação de otimização recomendada.
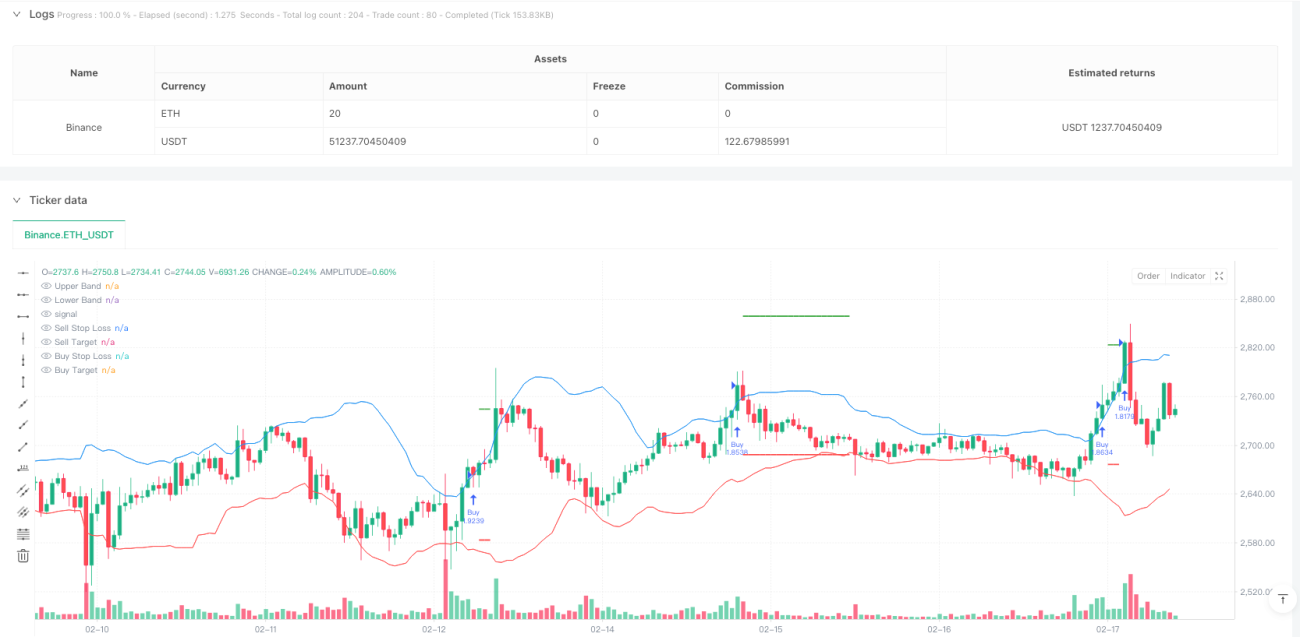
/*backtest
start: 2024-11-01 00:00:00
end: 2025-02-18 08:00:00
period: 1h
basePeriod: 1h
exchanges: [{"eid":"Binance","currency":"ETH_USDT"}]
*/

//@version=6
strategy("Bollinger Band Buy and Sell Strategy (Entry at Close of 3rd Candle)", overlay=true, default_qty_type=strategy.percent_of_equity, default_qty_value=10, pyramiding=0)

// Bollinger Band settings- 1