
Visão geral
A estratégia é um sistema de negociação integrado de vários indicadores, combinando indicadores técnicos como a média móvel do índice (EMA), o indicador de força relativa (RSI) e a amplitude real média (ATR) e introduzindo o índice de tendência média (ADX) para aumentar a precisão do julgamento de tendências. O sistema confirma a hora de estabelecer uma posição por meio de múltiplos sinais e usa o ATR para gerenciar dinamicamente os pontos de parada e de perda para obter um controle eficaz do risco.
Princípio da estratégia
O núcleo da estratégia é capturar as tendências do mercado e negociar através da combinação de múltiplos indicadores técnicos.
- Usando rápido ((20 ciclo) e lento ((50 ciclo) EMA para determinar a direção da tendência
- Combinando a força de confirmação da tendência com o ADX (ciclo 14), o ADX> 20 é necessário para a confirmação da tendência ser válida
- Usando o RSI (ciclo 14) para encontrar oportunidades de sobrevenda e sobrecompra, o RSI ultrapassa os 30 de compra e os 70 de venda
- O ATR (14 ciclos) é usado para calcular o stop loss dinâmico e a posição de parada, com a relação de risco/ganho definida em 2:1
Vantagens estratégicas
- A confirmação de múltiplos sinais aumenta a precisão das transações e evita sinais falsos
- A introdução do indicador ADX aumenta a confiabilidade do julgamento de tendências
- O mecanismo de parada de prejuízos dinâmico adapta-se às mudanças na volatilidade do mercado
- Controle de risco rigoroso para garantir que o risco de cada transação seja controlado
- A lógica da estratégia é clara e os parâmetros são altamente ajustáveis
Risco estratégico
- Indicadores múltiplos podem causar atraso no sinal e afetar o tempo de entrada
- O que pode gerar transações frequentes em mercados em turbulência
- O indicador ADX pode produzir um sinal de atraso em certas condições de mercado
- A configuração dos parâmetros precisa ser otimizada para diferentes cenários de mercado
Direção de otimização da estratégia
- Considere a inclusão de indicadores de volume de transação para aumentar a confiabilidade do sinal
- Introdução de filtros de taxa de flutuação do mercado para ajustar posições em períodos de alta volatilidade
- Desenvolver mecanismos de parâmetros de adaptação, ajustando-se à dinâmica do mercado
- Aumentar a graduação da intensidade da tendência e implementar a gestão dinâmica das posições
- Otimização da lógica de stop loss e introdução de mecanismos de stop loss móveis
Resumir
A estratégia, através da combinação orgânica de múltiplos indicadores técnicos, constrói um sistema de negociação de acompanhamento de tendências completo. A estratégia, ao mesmo tempo em que garante a precisão das negociações, garante a segurança das negociações por meio de rigorosos controles de risco. Embora haja algum espaço para otimização, a estrutura geral tem um bom valor prático e escalabilidade.
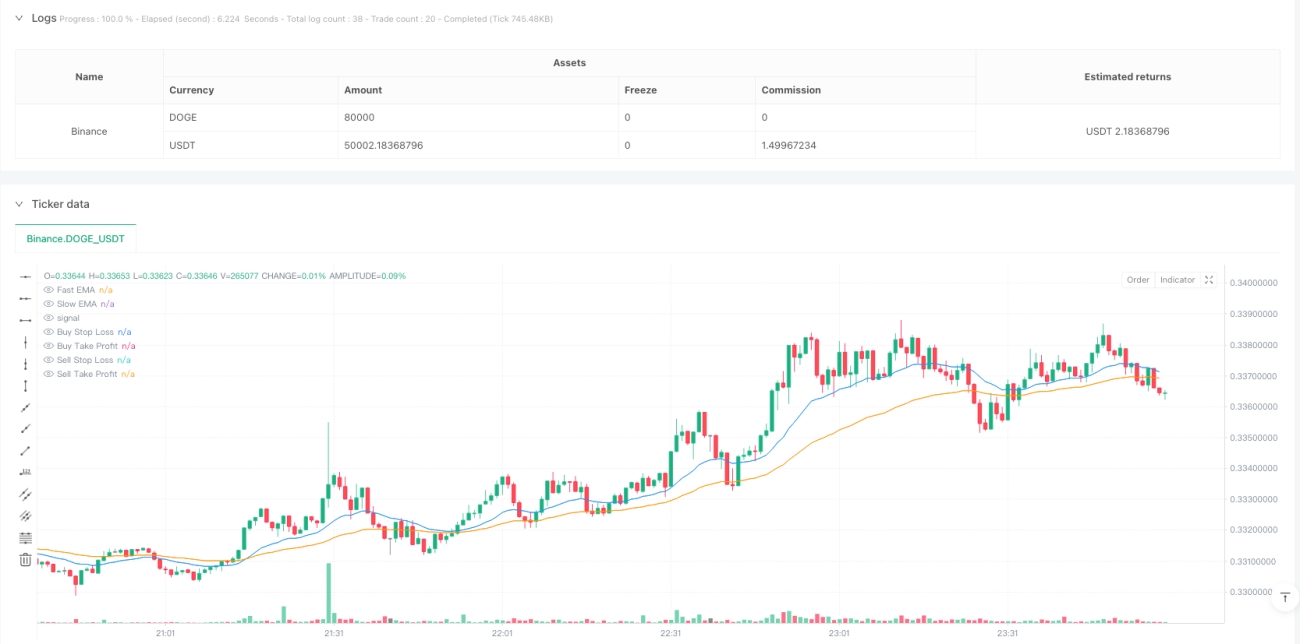
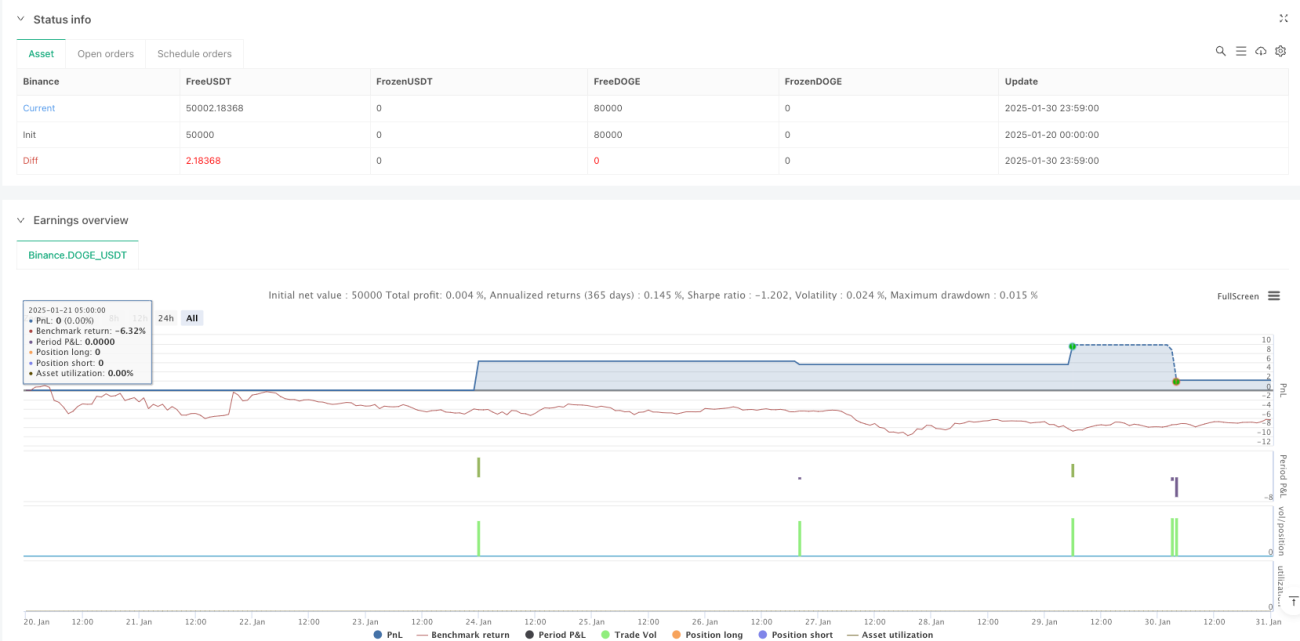
/*backtest
start: 2025-01-20 00:00:00
end: 2025-01-31 00:00:00
period: 1m
basePeriod: 1m
exchanges: [{"eid":"Binance","currency":"DOGE_USDT"}]
*/

//@version=5
strategy("Enhanced GBP/USD Strategy with ADX", overlay=true, default_qty_type=strategy.percent_of_equity, default_qty_value=1)

// === Input Parameters ===- 1