
Visão geral
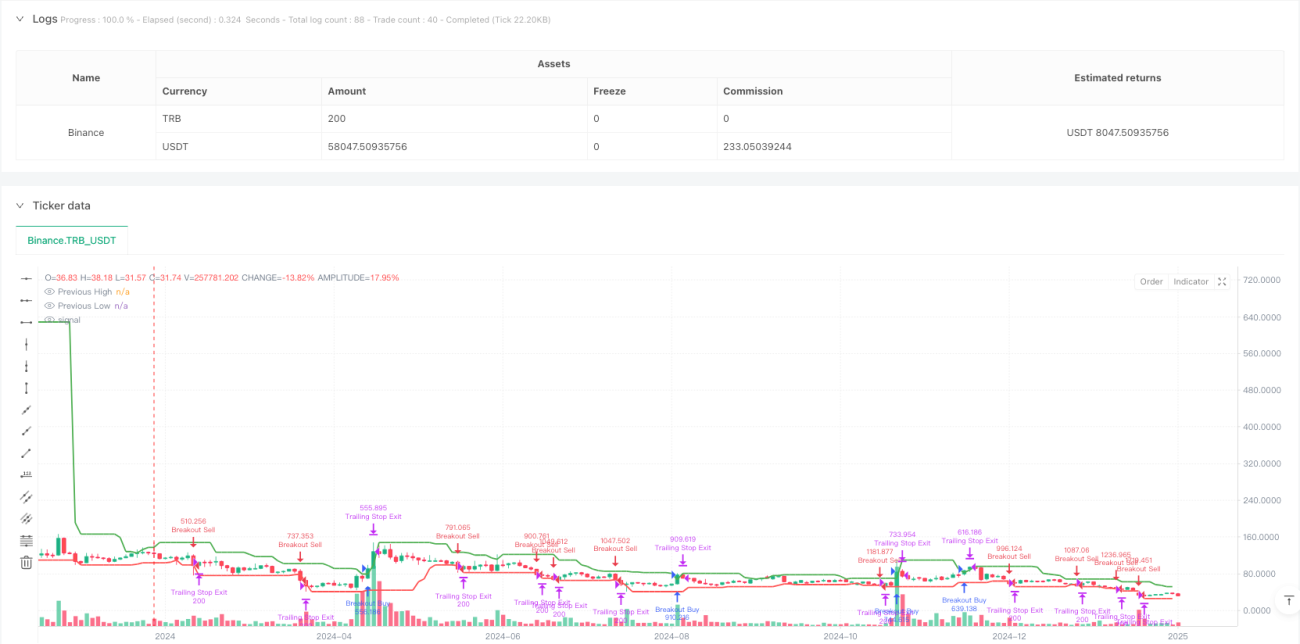
A estratégia é um sistema de negociação baseado em rupturas de preço e tracking stop loss dinâmico. Ela é executada através da monitorização dos preços mais altos e mais baixos dos últimos N ciclos e negociação quando os preços ultrapassam esses níveis críticos. A estratégia usa um mecanismo de stop loss inteligente, que ativa o tracking stop loss somente após a obtenção de 1% de lucro, permitindo que o lucro se desenvolva plenamente.
Princípio da estratégia
A lógica central da estratégia inclui as seguintes partes principais:
- Sinais de entrada: Trigger um sinal de negociação quando o preço atual quebra esses níveis, calculando os preços mais altos e mais baixos dos últimos N ciclos. A entrada em múltiplos níveis requer que o preço quebre os níveis mais altos do período anterior em uma determinada porcentagem, e o preço em branco precisa quebrar os níveis mais baixos do período anterior.
- Gerenciamento de transações: Implementar um período de arrefecimento de transações de uma hora para evitar transações frequentes em situações de alta volatilidade.
- Controle de Risco: Ativado somente após 1% de ganho, o stop loss de rastreamento dinâmico protege melhor os lucros.
- Optimização de parâmetros: os parâmetros-chave, como o ciclo de revisão, a ruptura da barreira e a porcentagem de parada, podem ser ajustados de acordo com as diferentes condições do mercado.
Vantagens estratégicas
- Gerenciamento de risco dinâmico: A estratégia permite que os lucros cresçam de forma sustentável, protegendo os lucros, através do rastreamento de mecanismos de stop loss.
- Adaptabilidade flexível: A estratégia pode se adaptar a diferentes condições de mercado, ajustando os parâmetros para otimizar o desempenho.
- Mecanismos de filtragem: uso de períodos de resfriamento para evitar transações excessivas e melhorar a qualidade das transações.
- Simples e eficaz: a lógica da estratégia é clara, fácil de entender e executar, mantendo uma boa escalabilidade.
Risco estratégico
- Risco de Falsa Breakout: O mercado pode ter uma falsa breakout, resultando em sinais errados. Recomenda-se aumentar a confirmação de volume de transação.
- Efeitos de deslizamento: durante os períodos de alta volatilidade, pode haver deslizamentos maiores que afetam a performance da estratégia.
- Sensibilidade de parâmetros: a performance da estratégia é sensível à configuração de parâmetros e precisa de otimização cuidadosa.
- Dependência do cenário de mercado: pode ter um desempenho fraco em um cenário de baixa volatilidade.
Direção de otimização da estratégia
- Introdução de indicadores de volume de transação: aumentar a confiabilidade do sinal de ruptura por meio da confirmação de volume de transação.
- Aumentar a filtragem de tendências: Combine com indicadores de tendências de longo prazo e negocie apenas na direção da tendência.
- Ajuste de parâmetros dinâmicos: ajuste automático de parâmetros de ruptura e parada de perdas de acordo com a volatilidade do mercado.
- Múltiplos períodos de tempo: Integração de sinais de vários períodos de tempo para melhorar a precisão.
Resumir
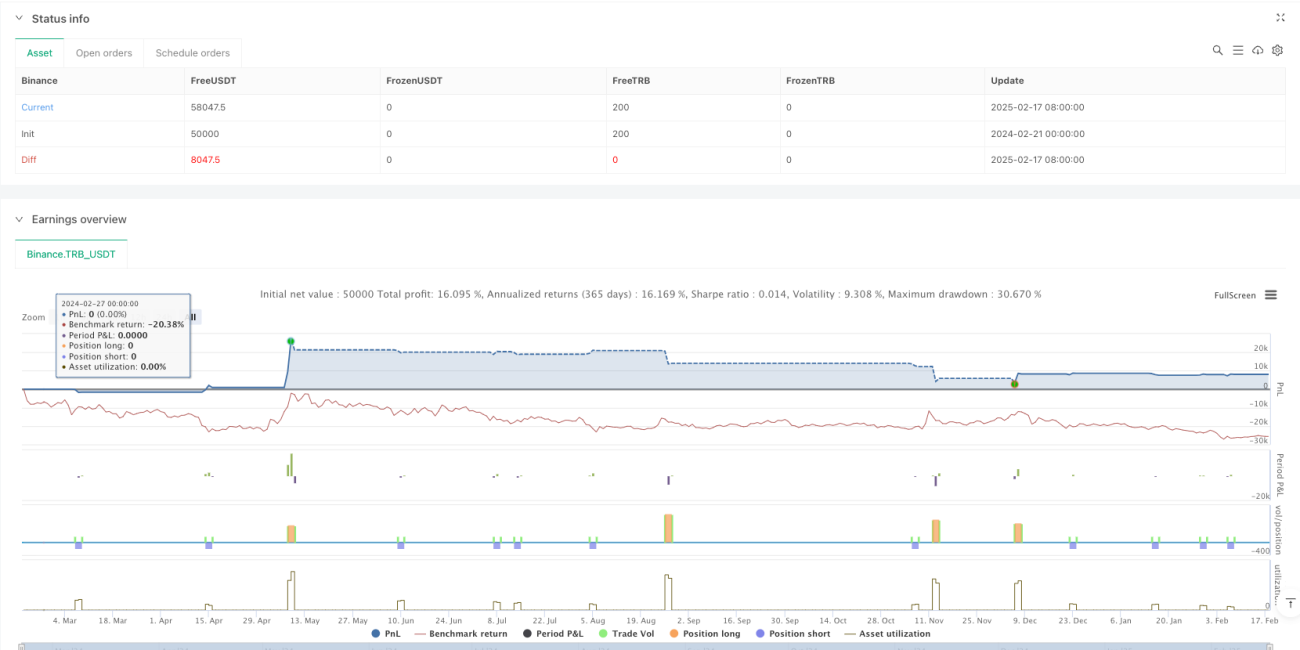
Trata-se de uma estratégia de seguimento de tendências razoavelmente concebida, combinada com breakouts de preços e paradas dinâmicas, que pode capturar grandes tendências e controlar eficazmente o risco. A estratégia é altamente personalizável e pode ser adaptada a diferentes ambientes de mercado por meio de otimização de parâmetros. É recomendado começar com posições pequenas no mercado real e verificar gradualmente o desempenho da estratégia em diferentes condições de mercado.
- 1