Estratégia de regressão cruzada RSI multinível

Visão geral
A estratégia é um sistema de negociação automatizado baseado em indicadores relativamente fracos (RSI) para capturar potenciais oportunidades de rebote, principalmente através da identificação de condições de sobrevenda no mercado. A estratégia utiliza um método de construção de posição progressivo, criando gradualmente várias posições quando o RSI cruza os baixos, e controle de risco através da definição de objetivos de lucro.
Princípio da estratégia
A lógica central da estratégia é baseada nos seguintes elementos-chave:
- O sinal de entrada: acionar um sinal de compra quando o indicador RSI de 14 ciclos atravessa o nível de supera venda de 28.5
- Gerenciamento de posição: 6.6% de utilidade da conta de uso de posição por construção de posição única, permitindo até 15 entradas de posição
- O lucro foi feito: quando o preço atingiu um aumento de 900% no preço médio de construção, o 50% da posição foi liquidada
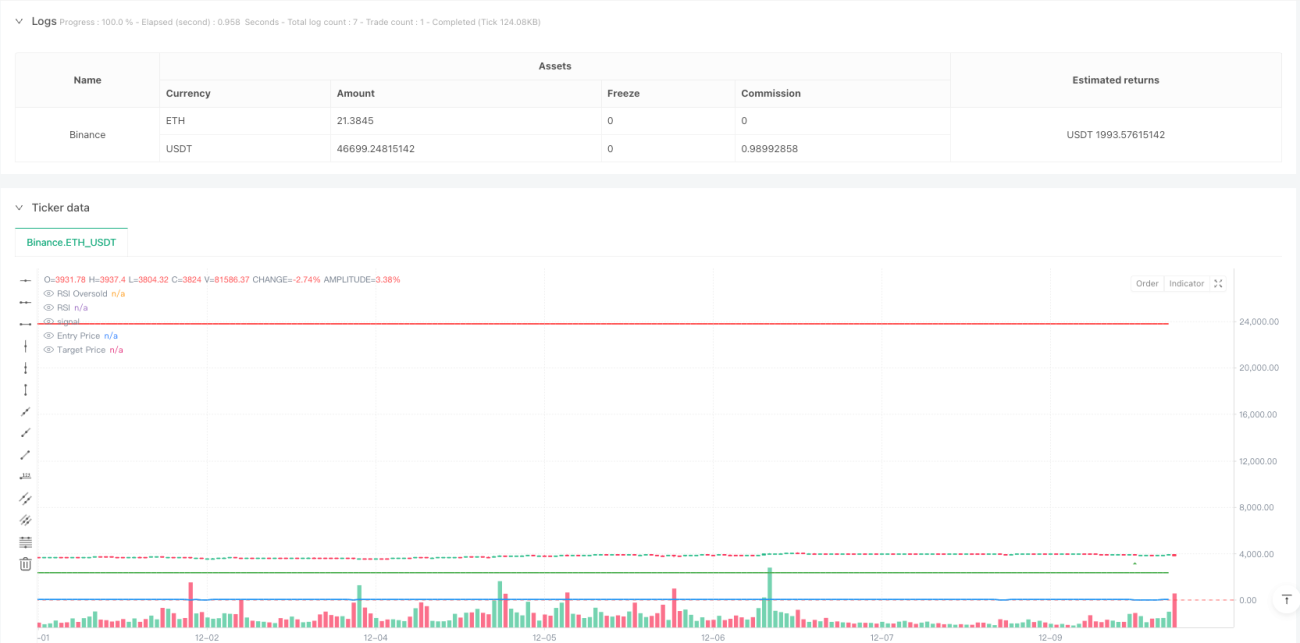
- Apresentação visual: sinais de compra e venda, curva RSI, preço de entrada e preço de meta marcados no gráfico
A estratégia é avaliar o comportamento do mercado observando o RSI nas áreas de oversold e, quando surgir um sinal de oversold, construir um estoque gradual para reduzir o custo de construção.
Vantagens estratégicas
- Posicionamento sistemático: Identificação automática de oportunidades de negociação por meio de parâmetros RSI predefinidos, evitando distorções subjetivas causadas por julgamentos humanos
- Dispersão de risco: a construção de posições de forma progressiva, criando várias posições a preços diferentes para dispersão de risco eficaz
- Adaptabilidade: os parâmetros da estratégia podem ser ajustados de acordo com diferentes cenários de mercado e preferências de risco individuais
- Proteção de lucro: estabelece um objetivo de lucro claro, reduz a posição automaticamente quando atingido e bloqueia parte do lucro
- Eficiência do capital: aumentar a eficiência do uso do capital por meio de mecanismos razoáveis de controle de posição e acréscimo de capital
Risco estratégico
- Risco de tendência: pode desencadear sinais de construção de posição com frequência em uma forte tendência de queda, resultando em perda de capital
- Parâmetros sensíveis: configurações inadequadas, como parâmetros RSI e proporções de construção de posição, podem afetar o desempenho da estratégia
- Liquidez de mercado: em mercados com pouca liquidez, pode ser difícil fechar transações a preços alvo
- Gerenciamento de fundos: excesso de hipoteca pode levar a uma abertura de risco excessiva
Solução:
- Aumentar os filtros de tendência e suspender a construção de uma posição em uma clara tendência de queda
- Configuração de parâmetros de otimização por feedback
- Configure o limite máximo de retirada
- Ajuste dinâmico do limiar de acréscimo
Direção de otimização da estratégia
- Parâmetros dinâmicos: ajuste automático dos parâmetros do RSI e das condições de posição de acordo com a volatilidade do mercado
- Mecanismos de parada de prejuízos: aumento da função de parada de prejuízos móveis para um melhor controle de riscos
- Filtragem de mercado: adicionar condições de filtragem como volume de transações, tendências e outros, para melhorar a qualidade do sinal
- Otimização de saída: conceber mecanismos de liquidação mais flexíveis, como redução de posições por etapas
- Controle de risco: aumento do limite máximo de retirada e controle de abertura de risco
Resumir
A estratégia identifica oportunidades de oversold através do indicador RSI, combina a hipoteca piramidal e a proporção fixa para lucrar e construir um sistema de negociação completo. A vantagem da estratégia é a operação sistematizada e a dispersão do risco, mas é necessário prestar atenção ao impacto da tendência do mercado e da configuração dos parâmetros no desempenho da estratégia.
/*backtest
start: 2024-09-15 00:00:00
end: 2024-12-10 00:00:00
period: 1h
basePeriod: 1h
exchanges: [{"eid":"Binance","currency":"ETH_USDT"}]
*/

//@version=5
strategy("RSI Cross Under Strategy", overlay=true, initial_capital=1500, default_qty_type=strategy.percent_of_equity, default_qty_value=6.6)

// Input parameters- 1