
Visão geral
A estratégia é um sistema de negociação auto-adaptável que combina o acompanhamento de tendências e negociação em intervalos. O sistema identifica o estado do mercado dinamicamente através do indicador ADX, e adota diferentes estratégias de negociação em mercados de tendência e de turbulência. Em mercados de tendência, a estratégia usa o sinal de cruzamento de média móvel combinado com a confirmação RSI e MACD; em mercados de turbulência, a estratégia utiliza o sistema de negociação de ruptura de borla combinado com o sinal de superacompra e superavenda RSI.
Princípio da estratégia
O núcleo da estratégia é o mecanismo de identificação do estado do mercado. A estratégia de acompanhamento de tendências é ativada quando o ADX é maior que 25 e é considerado um mercado de tendência:
- Condição multi-cabeça: 50 dias na linha média atravessa a linha média de 200 dias, enquanto o RSI é maior que 50 e a linha MACD está acima da linha de sinal
- Condição de cabeça vazia: 50 dias abaixo da linha média atravessa a linha média de 200 dias, enquanto o RSI é menor que 50 e a linha MACD está abaixo da linha de sinal
Quando o ADX for menor ou igual a 25 e for considerado um mercado de choque, utilize a estratégia de negociação intermitente:
- Condição de múltiplos cabeçalhos: preço sobe através da faixa de Brin para baixo e RSI menor que 40
- Condição de cabeça vazia: preço abaixo do traçado da faixa de Brin e RSI maior que 60
A configuração do stop loss utiliza o método de multiplicação dinâmica do ATR, com stop loss de 1,5 vezes o ATR e stop loss de 3 vezes o ATR.
Vantagens estratégicas
- Adaptabilidade de mercado: capacidade de alternar estratégias de negociação automaticamente de acordo com a situação do mercado
- Confirmação de múltiplos sinais: redução de falsos sinais através da combinação de vários indicadores técnicos
- Controle de risco perfeito: mecanismo de parada de prejuízos dinâmico para se adaptar às flutuações do mercado
- Lógicas de estratégia claras: critérios de julgamento de tendências e intervalos claros, facilitando o ajuste de otimização
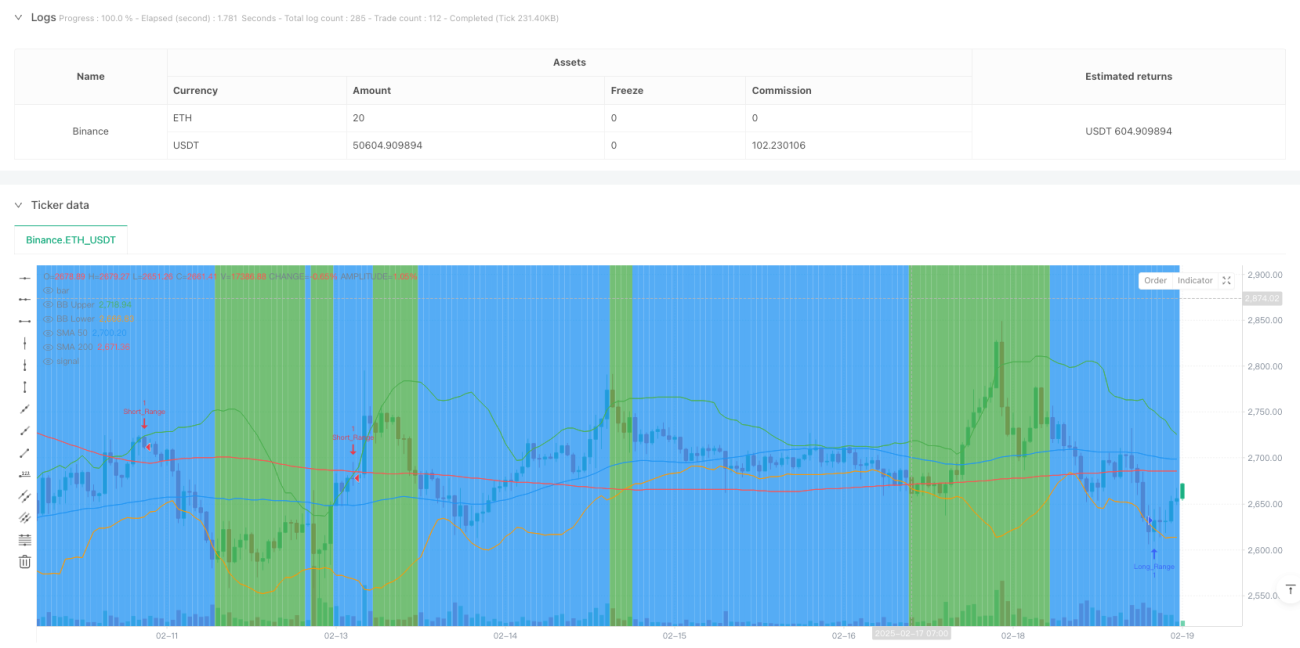
- A visualização é boa: o estado do mercado é intuitivo, distinguido pela cor do fundo
Risco estratégico
- Sinalização de atraso: indicadores como a média móvel têm um certo atraso, podendo perder o melhor ponto de entrada
- Risco de Falso Breakout: Brin pode trazer um falso sinal de breakout em um mercado em turbulência
- Sensibilidade de parâmetros: configurações de parâmetros, como o ADX, o ATR e outros, podem afetar o desempenho da estratégia
- Risco de troca de mercado: pode produzir sinais errados durante a transição entre tendências e turbulências
- Risco de stop loss: o stop loss ATR de um multiplicador fixo pode ser excessivo em períodos de alta volatilidade
Direção de otimização da estratégia
- Introdução de análise de volume de transação: adicionar um fator de volume de transação na confirmação do sinal, aumentando a confiabilidade do sinal
- Optimizar o julgamento do estado do mercado: considerar a mudança do ADX para depreciação dinâmica ou a combinação com outros indicadores
- Melhoria do mecanismo de stop loss: introdução de stop loss de rastreamento ou ajuste do ATR em função da variação da taxa de flutuação
- Aumentar o filtro de tempo: adicionar restrições de período de negociação, evitando períodos de baixa liquidez
- Melhoria do mecanismo de confirmação de sinais: análise de configuração de preços pode ser considerada para melhorar a qualidade do sinal
Resumir
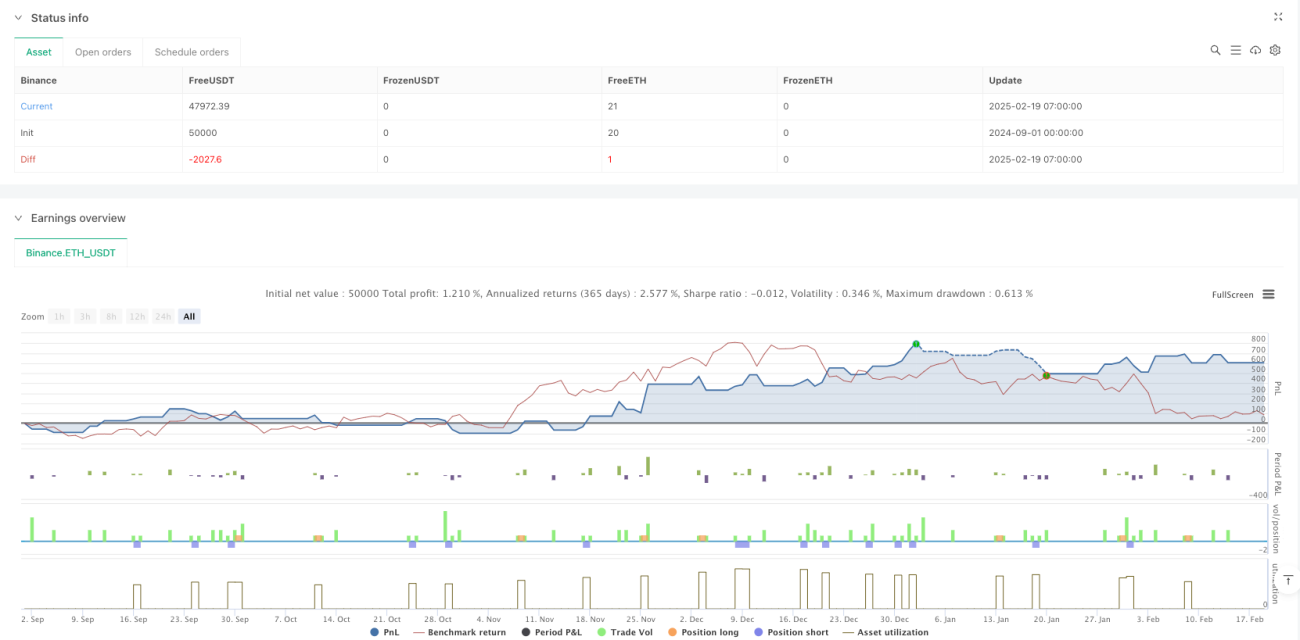
A estratégia é adaptada a diferentes ambientes de mercado através da identificação dinâmica do estado do mercado e da correspondente mudança de estratégia. A estratégia tem uma boa praticidade através da combinação de múltiplos indicadores técnicos e mecanismo de controle de risco dinâmico.
- 1