
Visão geral
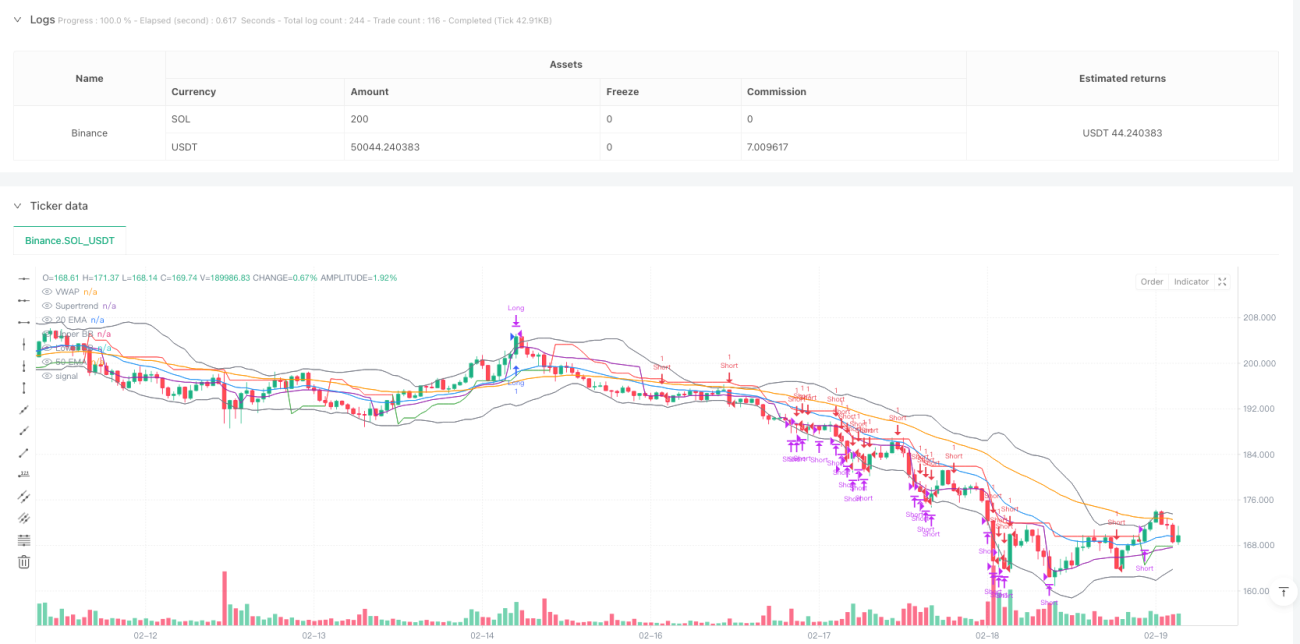
A estratégia é um sistema de negociação auto-adaptável que combina o acompanhamento de tendências e negociação de intervalos. Utiliza indicadores como Supertrend, Moving Average, ADX, RSI e Bollinger Bands para identificar o estado do mercado e determinar os sinais de negociação, ao mesmo tempo em que faz referência ao preço em combinação com o VWAP e configura um mecanismo de stop loss para controlar o risco.
Princípio da estratégia
A lógica central da estratégia é dividida em duas partes: acompanhamento de tendências e negociação de intervalos. Em mercados de tendências (determinados por ADX> 25), a estratégia gera sinais com base na direção da Supertrend, nas interseções EMA e nas posições VWAP. Em mercados de turbulência, a estratégia utiliza a fronteira de Brin e os níveis de RSI para comprar e vender.
- Modo de acompanhamento de tendências: ativado quando o ADX é > 25, combinado com a relação de posição do EMA de 20/50 de ciclo, a direção da Supertrend e a posição do VWAP em relação ao preço
- Modo de negociação intervalo: ativado quando o ADX <25 e entrar quando o preço toca a fronteira da faixa de Bryn e o RSI atinge o máximo
- Condições de saída incluem: Stop loss trigger, Supertrend reversão ou RSI atingindo extremos
Vantagens estratégicas
- Adaptabilidade: capacidade de alternar automaticamente entre os modos de negociação de acordo com as condições do mercado
- Confirmação múltipla: verificação cruzada de vários indicadores para aumentar a confiabilidade do sinal
- Controle de risco perfeito: configuração de stop loss de porcentagem fixa e ajuste dinâmico usando o RSI máximo
- Integração: Captação de tendências e lucro em mercados turbulentos
- Apoio em visualização: apresentação gráfica de indicadores importantes para facilitar a análise de decisões
Risco estratégico
- Sensibilidade de parâmetros: configurações de vários parâmetros do indicador afetam o desempenho da política
- Sinais de atraso: os indicadores técnicos têm um certo atraso
- Risco de Falsa Breakout: Falso sinal pode ser gerado no mercado de Forex
- Complexidade do cálculo: o cálculo em tempo real de vários indicadores pode afetar a eficiência da execução
- Adaptabilidade do mercado: pode ter um desempenho fraco em determinadas circunstâncias do mercado
Direção de otimização da estratégia
- Ajuste de parâmetros dinâmicos: pode ajustar automaticamente os parâmetros de cada indicador de acordo com a taxa de flutuação
- Introdução da análise de tráfego: aumento dos indicadores de tráfego para verificar a eficácia do sinal
- Optimizar o mecanismo de parada de perdas: o uso do ATR pode ser considerado
- Adição de filtro de tempo: adição de uma janela de tempo de negociação para evitar períodos de baixa eficiência
- Indicadores de Sentimento de Mercado: Integração de Indicadores de Sentimento de Mercado para Melhorar a Precisão das Previsões
Resumir
Esta é uma estratégia integrada de design racional e logicamente completo. Através da combinação de múltiplos indicadores e da troca de modelos, pode-se manter uma certa adaptabilidade em diferentes ambientes de mercado. Embora existam alguns riscos potenciais, a estratégia tem um bom valor de aplicação em campo com o controle racional do risco e otimização contínua. Recomenda-se a otimização de parâmetros e verificação de retorno em uso real.
- 1