Estratégia de cruzamento de média móvel exponencial de quebra de tendência dinâmica
EMA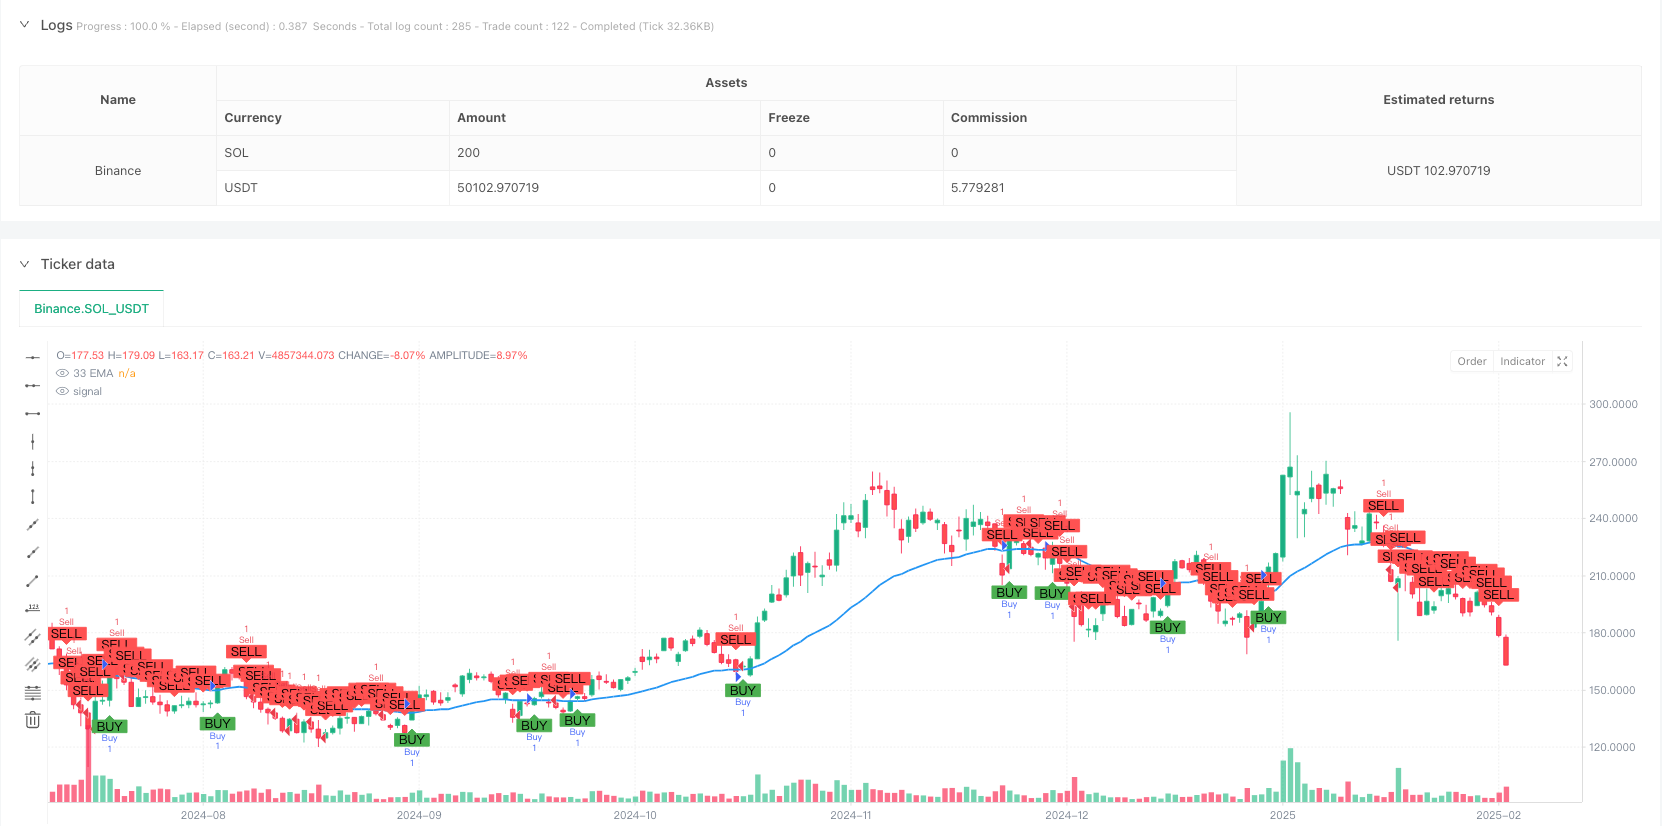
Visão geral
A estratégia é um sistema de negociação de acompanhamento de tendências baseado em uma média móvel de 33 ciclos do índice (EMA). Identifica as mudanças de tendências do mercado através da relação cruzada entre o preço e a EMA e, em combinação com os altos e baixos de flutuação, define uma posição de stop loss para acompanhar a dinâmica da tendência e controlar o risco.
Princípio da estratégia
A lógica central da estratégia é julgar a direção da tendência observando a relação cruzada entre o preço e a EMA de 33 ciclos. Quando o preço de fechamento se move para cima e se estabiliza na EMA, um sinal de brecha é acionado; Quando o preço de fechamento se move para baixo e se desloca para a EMA, um sinal de brecha é acionado. A estratégia usa os altos e baixos dos 14 ciclos como referência de flutuação, definindo o ponto mais alto como um único stop e o ponto mais baixo como um único stop.
Vantagens estratégicas
- Claridade do sinal: Use o cruzamento EMA como sinal de negociação, julgue com clareza objetiva e evite pressupostos subjetivos.
- Gerenciamento dinâmico: ajuste a posição de parada e perda de parada de forma dinâmica, adaptando-se às características de flutuação do mercado.
- Risco controlado: cada transação tem um ponto de parada definido para controlar o risco de forma eficaz.
- Seguimento de tendências: As características de tendências da EMA permitem uma melhor compreensão das tendências de médio e longo prazo.
- Optimização de parâmetros: os parâmetros-chave podem ser ajustados para facilitar a otimização de acordo com diferentes características do mercado.
Risco estratégico
- Prejuízos em mercados de choque: em mercados de choque horizontal, o cruzamento frequente pode levar a perdas contínuas.
- Risco de atraso: A EMA apresenta um certo atraso e pode perder pontos importantes no início da tendência.
- Risco de Falso Breakout: Os movimentos de preços de curto prazo podem causar Falso Breakout, resultando em sinais errados.
- Paragem: Usando o limite de flutuação como ponto de parada, em alguns casos, a paragem pode ser maior.
Direção de otimização da estratégia
- Introdução de filtros de tendência: pode ser adicionado um indicador de média ou tendência com períodos mais longos, para filtrar os sinais de negociação de mercados turbulentos.
- Melhorar o tempo de entrada: Combine os indicadores de oscilação como o RSI e entre em uma posição de preço mais favorável.
- Optimizar a configuração de parada: Considere a possibilidade de ajustar a distância de parada de forma dinâmica usando o ATR, para que o controle de vento seja mais flexível.
- Aumentar a confirmação de tráfego: adicionar a análise de tráfego para aumentar a confiabilidade do sinal.
- Melhorar o mecanismo de saída: conceber condições de saída mais detalhadas, como a introdução de stop loss móvel.
Resumir
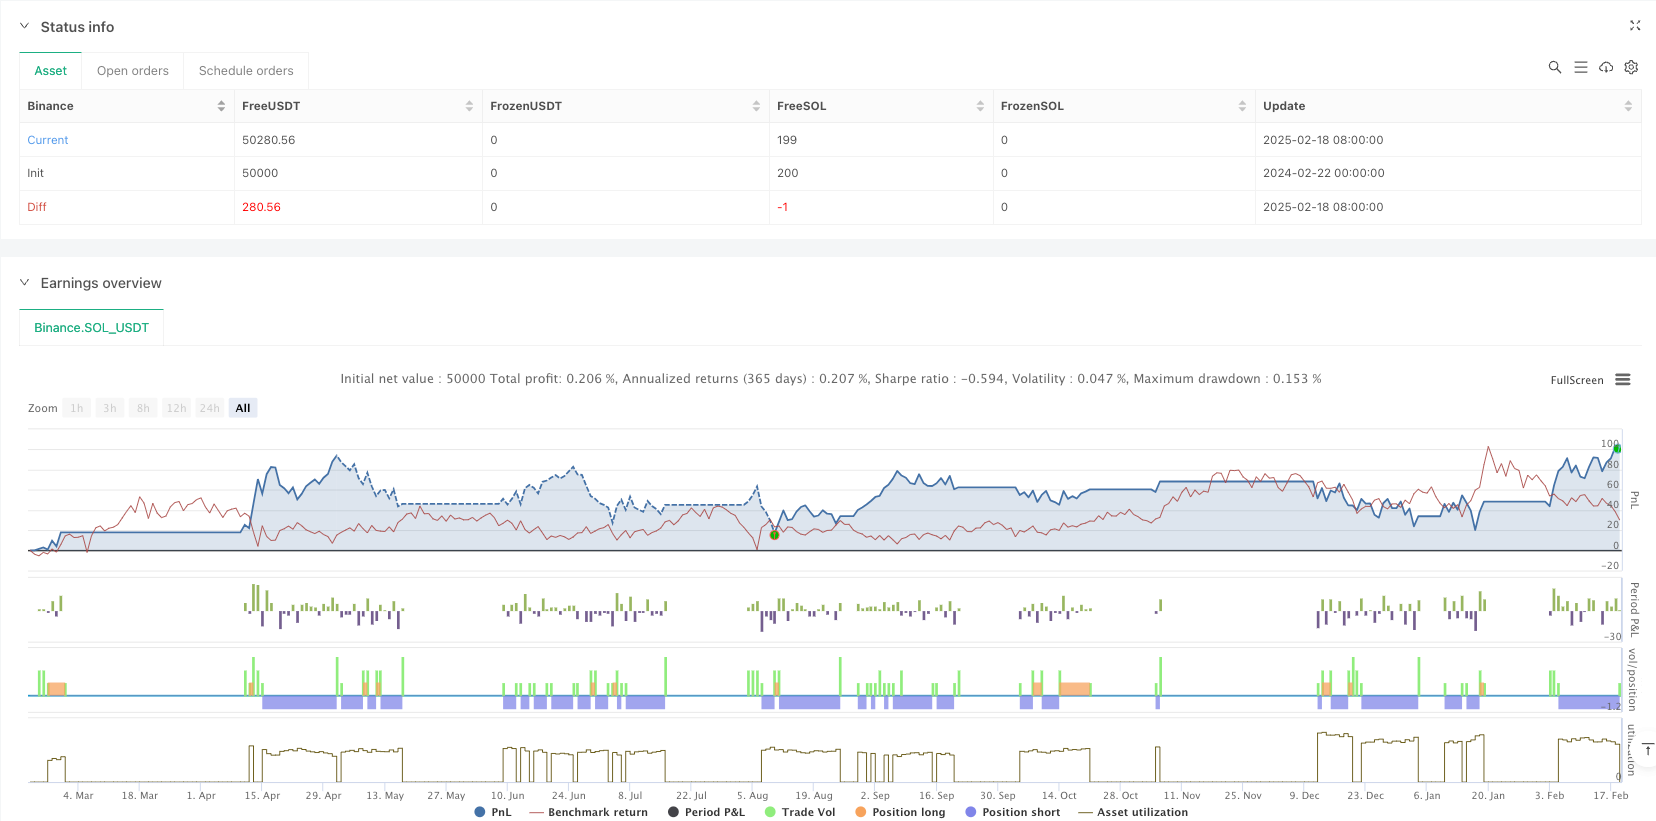
Esta é uma estratégia de acompanhamento de tendências com estrutura e lógica clara. Capturar a tendência através do cruzamento da EMA, gerenciar o risco com os pontos altos e baixos de flutuação, com uma boa praticidade. Embora existam algumas limitações inerentes, a estabilidade e a lucratividade da estratégia podem ser melhoradas com a orientação de otimização recomendada.
/*backtest
start: 2024-02-22 00:00:00
end: 2025-02-19 08:00:00
period: 1d
basePeriod: 1d
exchanges: [{"eid":"Binance","currency":"SOL_USDT"}]
*/

// This Pine Script™ code is subject to the terms of the Mozilla Public License 2.0 at https://mozilla.org/MPL/2.0/
// © GlenMabasa

//@version=6
strategy("33 EMA Crossover Strategy", overlay=true)

// Input for the EMA length
ema_length = input.int(33, title="EMA Length")

// Calculate the 33-day Exponential Moving Average
ema_33 = ta.ema(close, ema_length)

// Plot the 33 EMA
plot(ema_33, color=color.blue, title="33 EMA", linewidth=2)

// Buy condition: Price crosses and closes above the 33 EMA
buy_condition = ta.crossover(close, ema_33) and close > ema_33

// Sell condition: Price crosses or closes below the 33 EMA
sell_condition = ta.crossunder(close, ema_33) or close < ema_33

// Swing high and swing low calculations
swing_high_length = input.int(14, title="Swing High Lookback")
swing_low_length = input.int(14, title="Swing Low Lookback")
swing_high = ta.highest(high, swing_high_length) // Previous swing high
swing_low = ta.lowest(low, swing_low_length)    // Previous swing low

// Profit target and stop loss for buys
buy_profit_target = swing_high
buy_stop_loss = swing_low

// Profit target and stop loss for sells
sell_profit_target = swing_low
sell_stop_loss = swing_high

// Plot buy and sell signals
plotshape(series=buy_condition, title="Buy Signal", location=location.belowbar, color=color.green, style=shape.labelup, text="BUY")
plotshape(series=sell_condition, title="Sell Signal", location=location.abovebar, color=color.red, style=shape.labeldown, text="SELL")

// Strategy logic for backtesting
if (buy_condition)
    strategy.entry("Buy", strategy.long)
    strategy.exit("Take Profit/Stop Loss", "Buy", limit=buy_profit_target, stop=buy_stop_loss)

if (sell_condition)
    strategy.entry("Sell", strategy.short)
    strategy.exit("Take Profit/Stop Loss", "Sell", limit=sell_profit_target, stop=sell_stop_loss)