
Visão geral
A estratégia é um sistema de negociação de rastreamento de tendências baseado em uma ruptura do Canal Donchian, combinando um indicador de supertrend (SuperTrend) e um filtro de volume de transação para aumentar a confiabilidade do sinal de negociação. A estratégia identifica oportunidades de negociação potencialmente múltiplas capturando preços que ultrapassam os picos históricos, enquanto usa a confirmação de volume de transação e indicadores de rastreamento de tendências para filtrar falsos sinais de ruptura.
Princípio da estratégia
A lógica central da estratégia é baseada nos seguintes componentes principais:
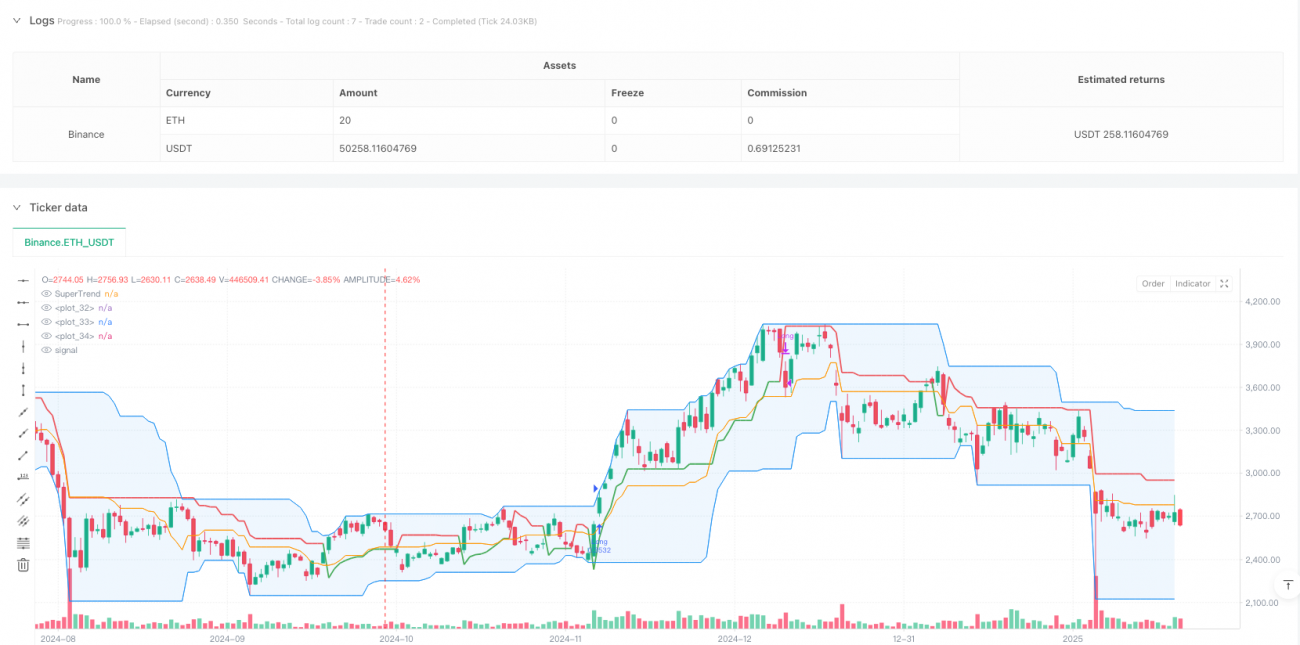
- Corredor de Tangjian: calcula o preço máximo e mínimo dentro do ciclo definido pelo usuário, formando o trajeto superior, inferior e médio. Quando o preço quebra o trajeto superior, aciona um sinal de entrada múltipla.
- Filtro de volume de transação: Compara o volume de transação atual com a média móvel de 20 ciclos, garantindo a entrada apenas quando o volume de transação aumenta, aumentando a confiabilidade da quebra.
- Indicador de tendência super: como ferramenta de confirmação de tendência, mostra verde quando a tendência é multi-cabeça, e vermelho quando a tendência é vazia.
- Mecanismo de parada flexível: oferece quatro opções de parada diferentes, incluindo parada de sub-carril, parada de meio-carril, parada de super-tendência e parada de percentual de seguimento.
Vantagens estratégicas
- Confirmação de múltiplos sinais: Combinação de ruptura de preços, confirmação de volume de transação e indicadores de tendência, reduzindo significativamente o risco de falsa ruptura.
- Adaptabilidade: adaptação a diferentes ambientes de mercado e ciclos de negociação através de ajustes de parâmetros.
- Gestão de riscos: oferece várias opções de parada de perdas, que podem ser escolhidas de acordo com as características do mercado.
- Visualização clara: a interface de estratégia mostra os indicadores de forma intuitiva, facilitando o entendimento do estado do mercado.
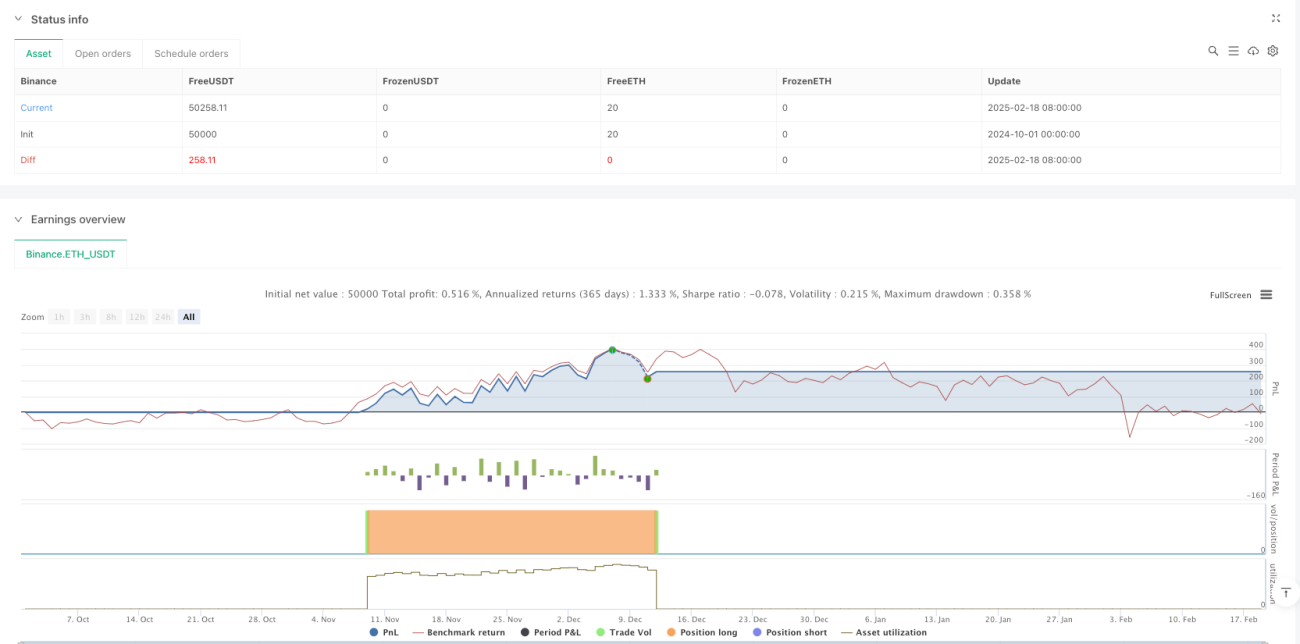
- Flexibilidade de retorno: Permite a personalização do intervalo de tempo de retorno, facilitando a otimização da estratégia.
Risco estratégico
- Risco de mercado de turbulência: Falso sinal de ruptura pode ocorrer com frequência em situações de turbulência intermitente.
- Risco de deslizamento: em mercados com pouca liquidez, o sinal de ruptura pode levar ao desvio do preço de entrada devido ao deslizamento.
- Risco de excesso de filtragem: Ativar a filtragem de volume de transação pode fazer com que você perca algumas oportunidades de negociação válidas.
- Sensibilidade dos parâmetros: O efeito da estratégia é sensível às configurações dos parâmetros e requer otimização cuidadosa.
Direção de otimização da estratégia
- Aumentar o filtro de intensidade da tendência: pode ser adicionado um indicador de intensidade da tendência, como o ADX, apenas quando a tendência é forte.
- Otimização do volume de transações: pode-se considerar o uso de volume de transações relativo ou de um indicador de ruptura de volume de transações em vez de uma média móvel simples.
- Adição de filtro de tempo: adicionar a configuração da janela de tempo de negociação para evitar os períodos de maior volatilidade do mercado.
- Otimização de parâmetros dinâmicos: ajuste automático de ciclos de canal e parâmetros de super tendência de acordo com a volatilidade do mercado.
- Introdução ao aprendizado de máquina: otimizar a seleção de parâmetros e a filtragem de sinais com algoritmos de aprendizado de máquina.
Resumir
A estratégia, através da aplicação integrada de vários indicadores técnicos, construiu um sistema de negociação de acompanhamento de tendências relativamente perfeito. A vantagem da estratégia é a alta confiabilidade do sinal, a flexibilidade de gerenciamento de risco, mas ainda requer que o comerciante otimize os parâmetros de acordo com as características específicas do mercado.
- 1