Estratégia de negociação de grade de Bollinger adaptável

Visão geral
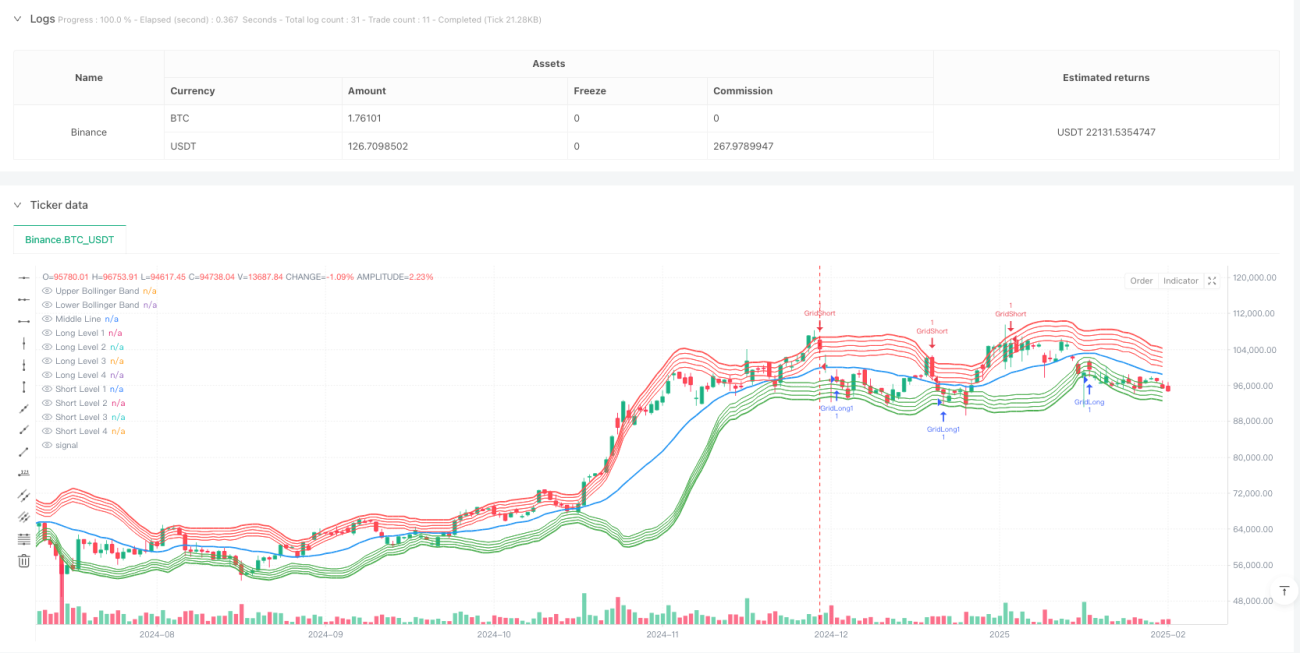
Trata-se de uma estratégia de negociação de grelha avançada baseada nos indicadores da faixa de Brin. Esta estratégia determina a posição da grelha através da dinâmica de ascensão e descensão da faixa de Brin e ajusta automaticamente o intervalo da grelha de acordo com a volatilidade do mercado.
Princípio da estratégia
A estratégia usa uma média móvel de 20 ciclos como o meio da faixa de brinquedos, e o dobro da diferença padrão como a largura de banda. Com base na faixa de brinquedos, a estratégia configura 4 níveis de grade entre os trilhos de cima e de baixo, com um intervalo de grade de 1%. Quando o preço sobe para cima, o sistema executa várias operações; Quando o preço desce para baixo, o sistema executa uma operação de vazio.
Vantagens estratégicas
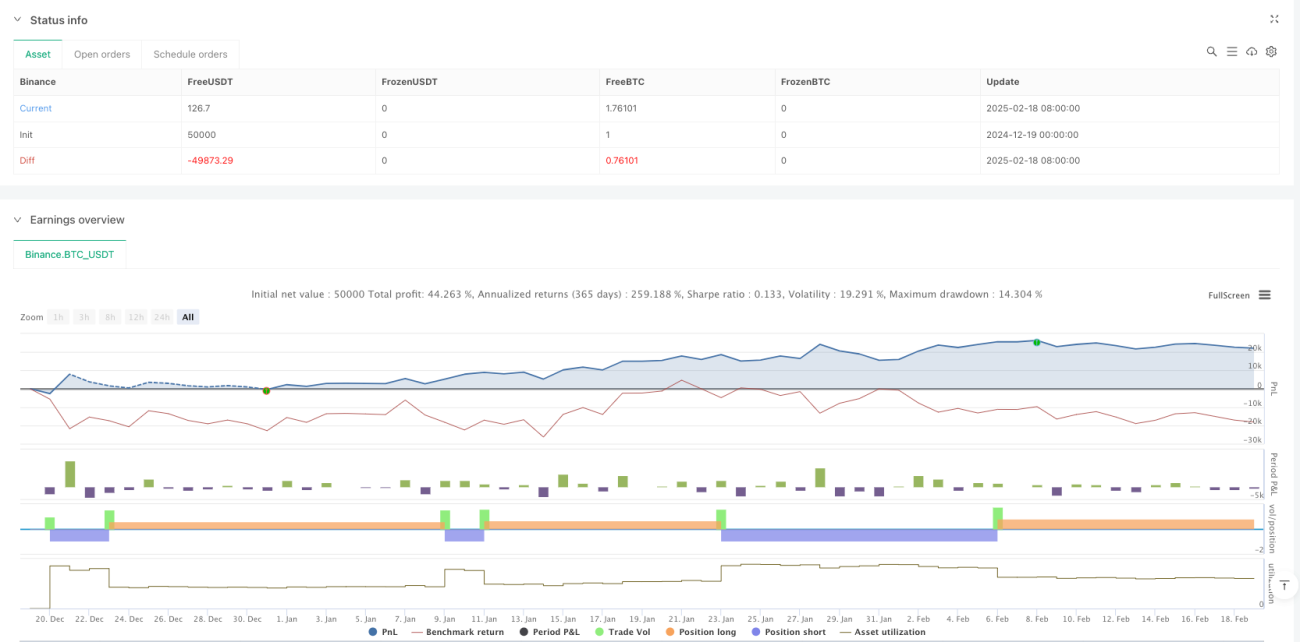
- Ajuste dinâmico - a posição da grade se move com a faixa de Bryn, permitindo que a estratégia se adapte a diferentes cenários de mercado
- Risco controlado - Limitação do intervalo de negociação por meio da faixa de Brin para evitar excesso de posições em situações extremas
- Alta automatização - o sistema executa transações automaticamente, sem a intervenção humana
- Negociação bidirecional - pode ser lucrativa em alturas de alta e baixa
- Parâmetros ajustáveis - o intervalo de grade e o número de níveis podem ser ajustados com flexibilidade conforme necessário
Risco estratégico
- Risco de mercado de tendência - pode haver uma retracção maior em um cenário de tendência unilateral
- Risco de gestão de fundos - a ação simultânea de várias grades pode levar a excesso de posições
- Risco de deslizamento - os preços de transação podem desviar-se do preço da grelha em situações de forte volatilidade do mercado
- Risco tecnológico - Falso sinal de ruptura na faixa de Brin
Solução:
- Configurar um limite de posição total
- Introdução de filtros de tendências
- Mecanismos de execução de encomendas
- Adicionar filtro de sinal de confirmação
Direção de otimização da estratégia
- Espaçamento de grelha adaptável - ajuste dinâmico do espaçamento de grelha de acordo com a taxa de flutuação
- Introdução de relações de quantidade e preço - a combinação de indicadores de quantidade para otimizar o momento de entrada
- Otimização do mecanismo de suspensão - conceber um plano de suspensão mais flexível
- Otimização da gestão de fundos - Gestão de posições baseada no risco
- Sincronização de múltiplos períodos de tempo - introdução de mecanismos de confirmação de sinais de múltiplos períodos
Resumir
A estratégia, através da combinação de transações em Brin-Band e Grid, permite um sistema de negociação automatizado com flexibilidade e estabilidade. A principal vantagem da estratégia é a capacidade de se adaptar a diferentes ambientes de mercado e, ao mesmo tempo, controlar o risco por meio de ajustes de parâmetros. Embora existam alguns riscos inerentes, é possível construir um sistema de negociação mais robusto com otimização e aperfeiçoamento contínuos.
- 1