Visão geral
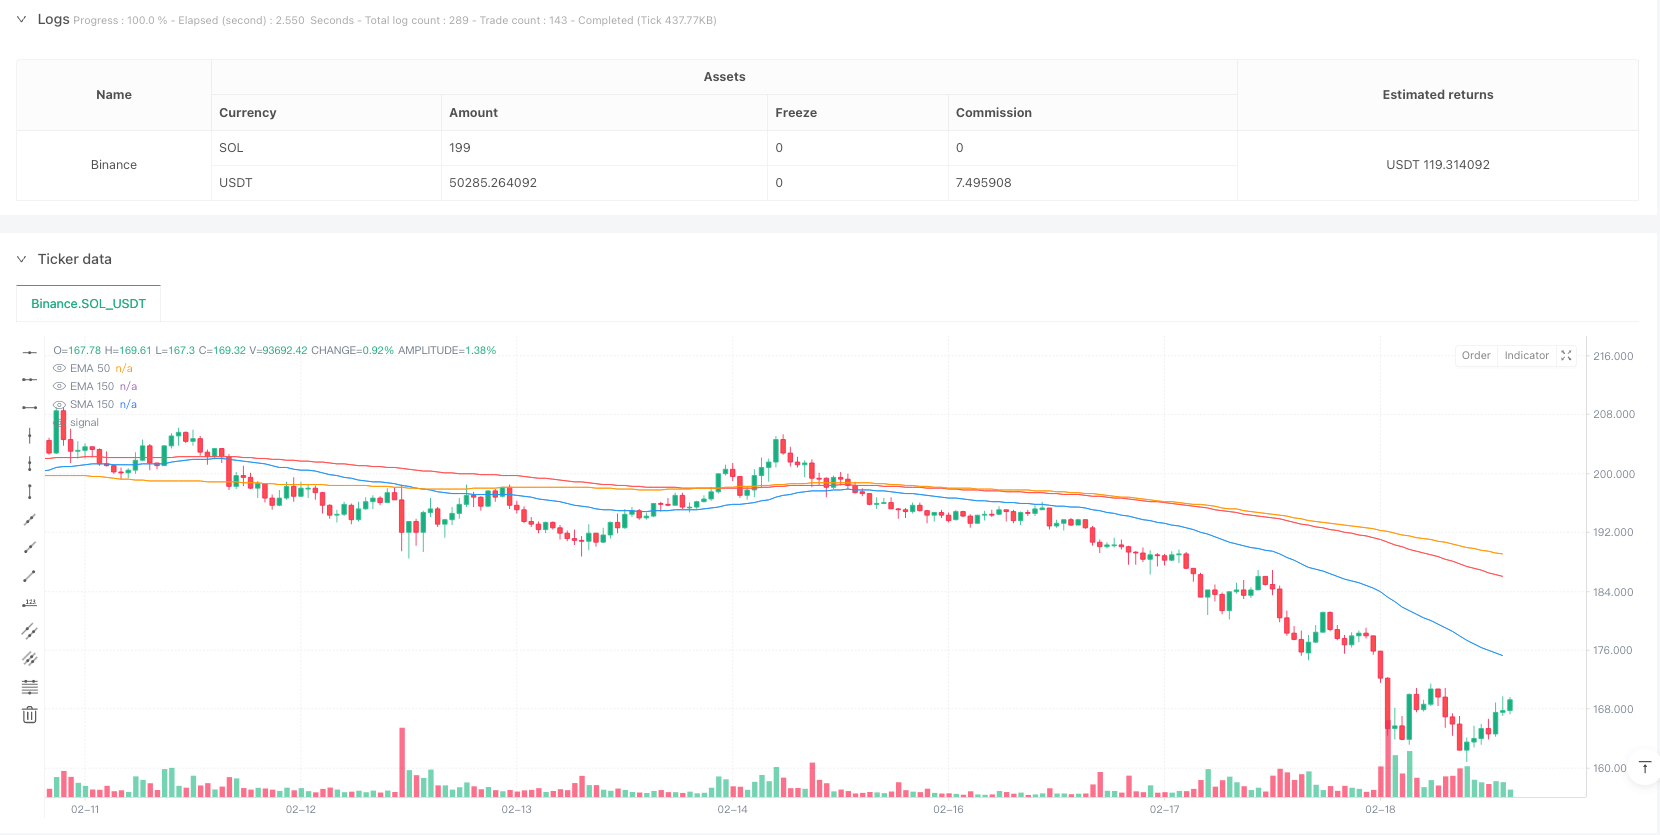
A estratégia é um sistema de negociação de acompanhamento de tendências que combina as médias móveis indexadas (EMA) e as médias móveis simples (SMA). A estratégia utiliza principalmente o EMA50 para gerar sinais de negociação cruzados com o EMA150, ao mesmo tempo em que usa o SMA150 como linha de parada e inclui um mecanismo de reentrada após a parada.
Princípio da estratégia
A lógica central da estratégia inclui os seguintes elementos-chave:
- Sinal de entrada: quando o EMA50 atravessa o EMA150 para cima, gera um sinal de multitude; quando o EMA50 atravessa o EMA150 para baixo, gera um sinal de vazio.
- Mecanismo de Stop Loss: Quando o preço cai abaixo do SMA 150, o Stop Loss é acionado.
- Mecanismo de reentrada: após o disparo do stop loss, se o preço repassa a EMA150, a reentrada faz mais; se a EMA50 atravessa a EMA150 novamente, a entrada é vazia.
- Execução de transações: a estratégia executa as transações no período de tempo indicado e considera uma comissão de 0,1% e um ponto de deslizamento de 3 pontos.
Vantagens estratégicas
- Forte capacidade de rastreamento de tendências: Captura eficazmente as tendências do mercado usando combinações de linhas médias de diferentes períodos.
- Controle de risco: estabelece condições de stop loss claras para evitar perdas excessivas.
- O mecanismo de reentrada é flexível: permite a reentrada quando as condições do mercado melhoram, aumentando as oportunidades de lucro.
- A configuração dos parâmetros é razoável: a seleção de períodos de EMA50 e EMA150 equilibra a sensibilidade e a estabilidade.
- Considere os custos reais das transações: comissão e slippage são incluídos, mais próximos do ambiente de transações reais.
Risco estratégico
- Risco de mercado em choque: Falso sinal de ruptura pode ocorrer com frequência em mercados em choque lateral.
- Risco de atraso: o próprio indicador de média móvel tem atraso, podendo perder o melhor momento de entrada.
- Risco de reentrada: em mercados altamente voláteis, o mecanismo de reentrada pode levar a perdas contínuas.
- Riscos de gestão de fundos: a estratégia não inclui um programa específico de gestão de posições.
- Dependência do cenário de mercado: a estratégia pode ter um desempenho muito diferente em diferentes ciclos de mercado.
Direção de otimização da estratégia
- Introdução de indicadores de volatilidade: ATR ou Bollinger Bands podem ser adicionados para ajustar a posição de parada, tornando a parada mais adaptável.
- Melhoria da gestão de posições: recomenda-se a inclusão de um sistema de gestão de posições dinâmico baseado na volatilidade.
- Optimizar as condições de reentrada: pode ser combinado com indicadores de oscilação como o RSI para melhorar a precisão do sinal de reentrada.
- Aumentar o filtro de mercado: adicionar indicadores de intensidade de tendência e reduzir a frequência de negociação em mercados de baixa tendência.
- Desenvolver parâmetros de adaptação: pode ajustar dinamicamente o período médio de linha de acordo com as flutuações do mercado.
Resumir
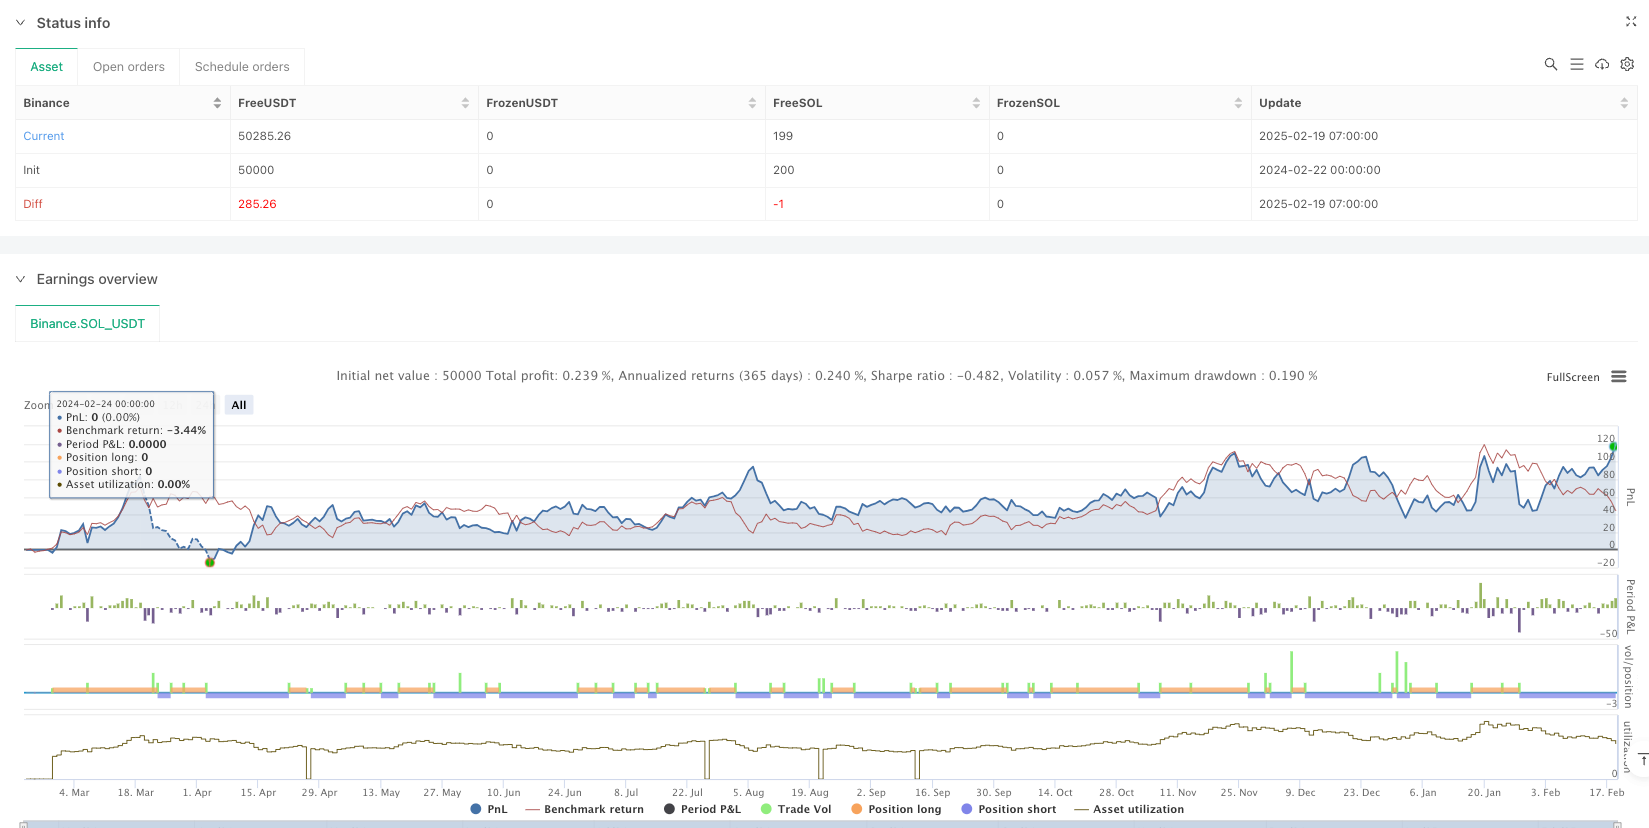
Trata-se de uma estratégia de rastreamento de tendências razoavelmente concebida, que capta tendências por meio de cruzamentos lineares e está equipada com um mecanismo de controle de risco perfeito. A principal vantagem da estratégia reside na capacidade de rastreamento de tendências do sistema e no projeto de gerenciamento de riscos, mas na aplicação prática é necessário prestar atenção ao impacto do ambiente de mercado no desempenho da estratégia.
/*backtest
start: 2024-02-22 00:00:00
end: 2025-02-19 08:00:00
period: 1h
basePeriod: 1h
exchanges: [{"eid":"Binance","currency":"SOL_USDT"}]
*/

//@version=6
strategy("EMA 50 and EMA 150 with SMA150 Stop-loss and Re-Entry #ganges", overlay=true, commission_type=strategy.commission.percent, commission_value=0.1, slippage=3)


// EMA and SMA Calculations
ema50 = ta.ema(close, 50)
ema150 = ta.ema(close, 150)
sma150 = ta.sma(close, 150)

// Conditions for Buy, Sell, and Stop-Loss
ema50CrossAboveEMA150 = ta.crossover(ema50, ema150)  // Buy signal
ema50CrossBelowEMA150 = ta.crossunder(ema50, ema150) // Sell signal
priceCrossAboveEMA150 = ta.crossover(close, ema150) // Price crosses EMA 150 from below
priceCloseBelowSMA150 = close < sma150              // Stop-loss for long positions


// Track stop-loss hit state
var bool stopLossHit = false

// Strategy Logic
// Buy Logic: EMA 50 crosses EMA 150 from below
if ema50CrossAboveEMA150
    strategy.entry("Buy Signal", strategy.long, qty=1)
    stopLossHit := false // Reset stop-loss state when a new buy position is opened

// Sell Logic: EMA 50 crosses EMA 150 from above
if ema50CrossBelowEMA150
    strategy.entry("Sell Signal", strategy.short, qty=1)
    stopLossHit := false // Reset stop-loss state when a new sell position is opened

// Stop-Loss for Long Positions: Close if price falls below SMA 150
if strategy.position_size > 0 and priceCloseBelowSMA150
    strategy.close("Buy Signal")
    stopLossHit := true // Mark stop-loss hit

// Re-Entry Logic After Stop-Loss
if stopLossHit
    if priceCrossAboveEMA150 // Re-buy logic: PRICE crosses EMA 150 from below
        strategy.entry("Re-Buy Signal", strategy.long, qty=1)
        stopLossHit := false // Reset stop-loss state after re-entry
    if ema50CrossBelowEMA150 // Re-sell logic: EMA 50 crosses EMA 150 from above
        strategy.entry("Re-Sell Signal", strategy.short, qty=1)
        stopLossHit := false // Reset stop-loss state after re-entry

// Plot EMA and SMA Lines
plot(ema50, color=color.blue, title="EMA 50")
plot(ema150, color=color.red, title="EMA 150")
plot(sma150, color=color.orange, title="SMA 150")


// // Calculate Recent All-Time High
// highestHigh = ta.highest(high, 500) // Lookback period of 500 bars
// percentageFall = ((highestHigh - close) / highestHigh) * 100

// // Display Percentage Fall on the Most Recent Candle Only
// isLastBar = bar_index == ta.max(bar_index)
// if isLastBar
//     labelText = str.tostring(percentageFall, "#.##") + "% Fall from ATH"
//     labelPosition = high + ta.atr(14) * 2 // Positioning label above the candle
//     label.new(bar_index, labelPosition, labelText, color=color.red, textcolor=color.white, size=size.small, style=label.style_label_down)