
2
Follow
478
Followers
Visão geral
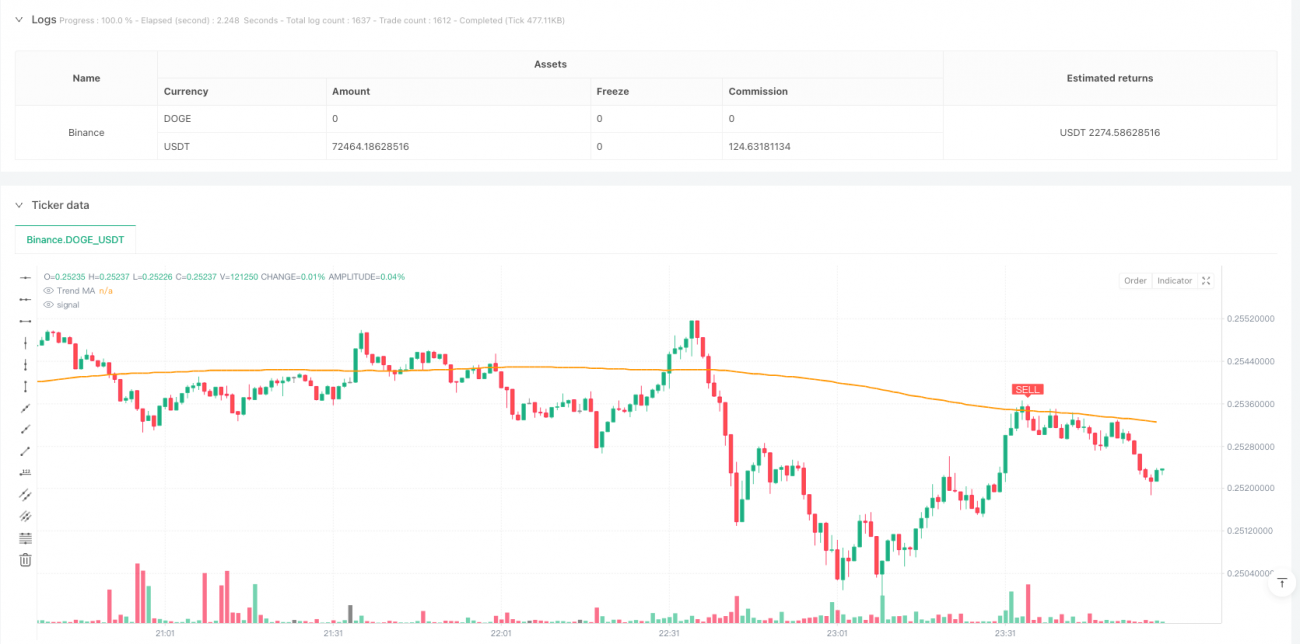
Esta estratégia é um sistema de negociação de dupla filtragem que combina o RSI (indicador relativamente forte) e a linha média de tendência. A estratégia é executada em níveis de linha diária, combinando o sinal de sobrecompra e sobrevenda do RSI com a linha média de tendência de longo prazo. O núcleo da estratégia é o aumento do filtro de tendência na base do tradicional sinal de negociação do RSI para aumentar a precisão e a confiabilidade da negociação.
Princípio da estratégia
A estratégia baseia-se principalmente nos seguintes componentes centrais:
- O indicador RSI é usado para identificar áreas de sobrecompra e sobrevenda, com um parâmetro padrão de 14 ciclos
- O nível de sobrecompra está definido em 70 e o nível de sobrevenda está definido em 30.
- A média móvel simples de 200 ciclos como um filtro de tendência
- Condições de compra: RSI sobe da zona de oversold e preço está acima da linha média
- Condições de venda: RSI quebra para baixo da zona de sobrecompra e o preço está abaixo da linha média
A estratégia executa automaticamente a transação em cada sinal e pode ser configurada para a função de alerta.
Vantagens estratégicas
- O mecanismo de dupla confirmação aumenta significativamente a confiança das transações
- Combinação de tendências e indicadores de dinâmica para reduzir o risco de falsos sinais
- Sistema de execução de transações totalmente automatizado
- Configuração flexível de parâmetros permite otimização de estratégias
- A função de alerta em tempo real é integrada para facilitar a operação
- A interface visível mostra claramente os sinais de negociação
- Suporte a função de retrospecção para facilitar a validação de estratégias
Risco estratégico
- Mercado em turbulência pode gerar sinais de negociação frequentes
- Os pontos de viragem podem estar atrasados
- Configurações de parâmetros inadequadas podem afetar o desempenho da estratégia
- A maior retração pode ocorrer em situações de extrema volatilidade do mercado.
Recomenda-se que os riscos sejam gerenciados da seguinte forma:
- Estabelecer uma posição de parada razoável
- Ajuste adequado do tamanho da posição
- Optimizar os parâmetros da estratégia periodicamente
- Indicadores técnicos auxiliares em combinação com outros
Direção de otimização da estratégia
- Aumentar os filtros de volatilidade e ajustar os padrões de negociação durante a alta volatilidade
- Introdução de um mecanismo de parâmetros de adaptação, ajustando os parâmetros de acordo com a dinâmica do mercado
- Adicionar mecanismo de confirmação de volume para melhorar a confiabilidade do sinal
- Desenvolver mecanismos de saída mais complexos para otimizar o tempo de expiração
- Integração de análises de múltiplos períodos de tempo para uma visão mais abrangente do mercado
Resumir
A estratégia, em combinação com o RSI e a linha de tendência, constrói um sistema de negociação estável. A estratégia é projetada de forma razoável, as regras de operação são claras e tem uma boa praticidade.
Source
Pine
/*backtest
start: 2025-02-13 00:00:00
end: 2025-02-20 00:00:00
period: 1m
basePeriod: 1m
exchanges: [{"eid":"Binance","currency":"DOGE_USDT"}]
*/
//@version=5
strategy("Leading Indicator Strategy – Daily Signals", overlay=true,
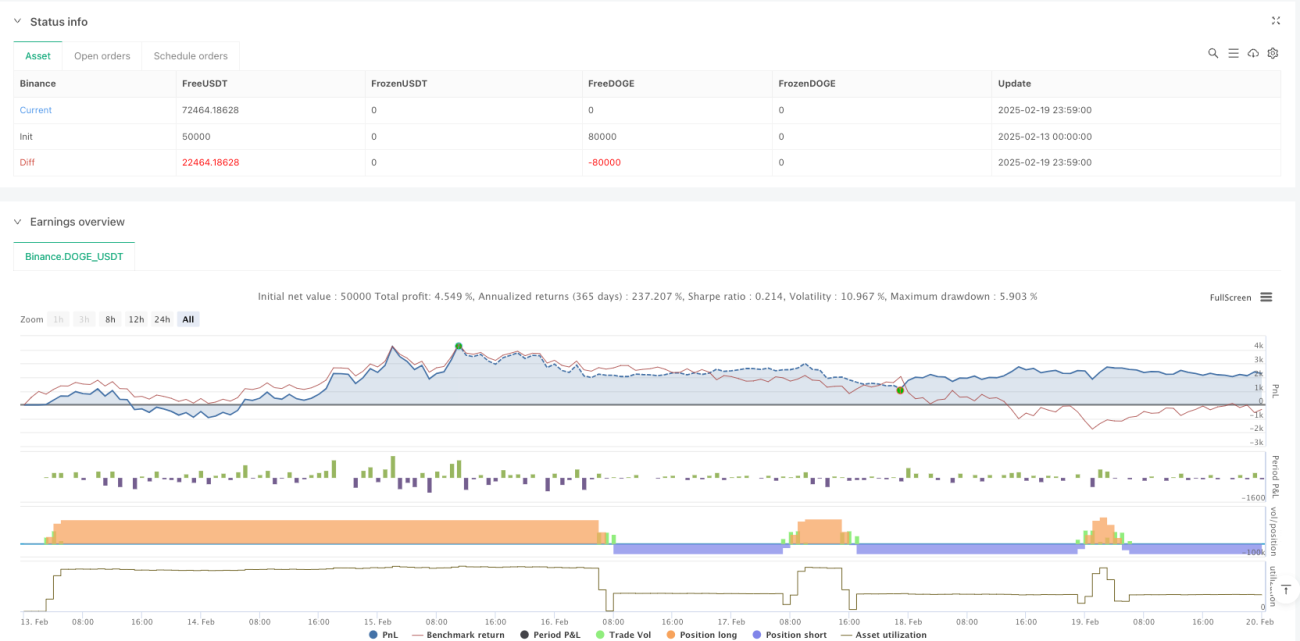
pyramiding=1, initial_capital=100000,
default_qty_type=strategy.percent_of_equity, default_qty_value=100)Strategy parameters
Related strategies
Comment
All comments (0)
No data
- 1