
Visão Geral
A Estratégia de Momentum Adaptativo com Base na Teoria de Dow é uma abordagem de negociação avançada fundamentada nos princípios clássicos da Teoria de Dow, projetada para orientar decisões de negociação ao identificar pontos de inflexão chave nas tendências do mercado. A estratégia foca em detectar e confirmar a dinâmica fundamental das tendências de preço, utilizando topos mais altos (Higher Highs) e fundos mais altos (Higher Lows) para definir tendências de alta, e topos mais baixos (Lower Highs) e fundos mais baixos (Lower Lows) para definir tendências de baixa. Este método visa fornecer uma abordagem sistemática para capturar as tendências do mercado e reagir prontamente quando ocorrem mudanças de tendência.
Princípios da Estratégia
O princípio central desta estratégia baseia-se no método clássico de identificação de tendências da Teoria de Dow. A estratégia detecta pontos de inflexão chave utilizando as funções ta.pivothigh() e ta.pivotlow(). A implementação específica inclui as seguintes etapas principais:
- Detecção de Pontos de Inflexão: Utiliza o parâmetro
pivotLookbackpara determinar o número de barras em ambos os lados, a fim de identificar topos e fundos. - Confirmação de Tendência: Uma tendência de alta é confirmada apenas quando as condições de topos mais altos e fundos mais altos são satisfeitas simultaneamente; da mesma forma, uma tendência de baixa é confirmada apenas quando as condições de topos mais baixos e fundos mais baixos são satisfeitas.
- Persistência da Tendência: Se as condições de reversão não forem atendidas, a estratégia mantém o estado de tendência anterior, proporcionando um acompanhamento mais suave da tendência.
Vantagens da Estratégia
- Identificação Dinâmica de Tendências: Ao analisar continuamente os pontos de inflexão chave, a estratégia captura dinamicamente as mudanças de tendência do mercado.
- Modos de Negociação Flexíveis: Oferece três modos de negociação – automático, apenas comprado e apenas vendido – atendendo às necessidades de diferentes traders.
- Gestão de Risco: Mecanismos embutidos de stop-loss e take-profit controlam efetivamente o risco de cada negociação individual.
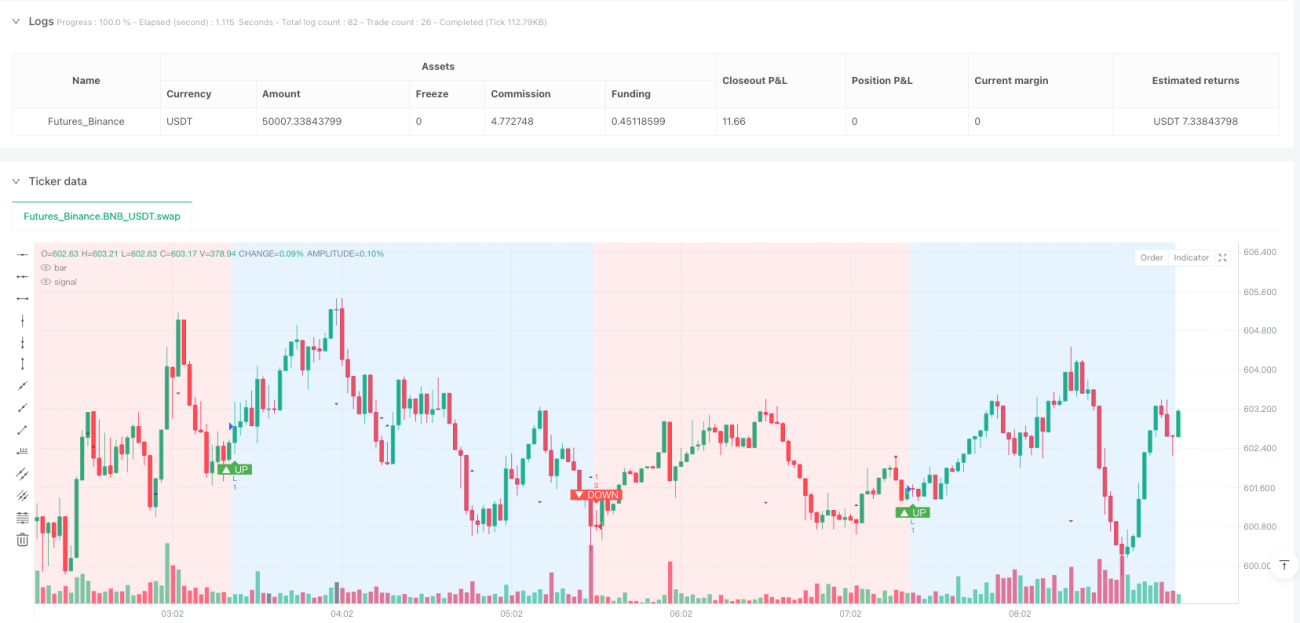
- Visualização de Tendências: Exibe a direção da tendência de forma intuitiva através de cores de fundo e marcadores, facilitando a compreensão das condições de mercado pelos traders.
- Baixa Latência: Comparada às estratégias tradicionais baseadas em médias móveis, este método responde mais rapidamente às mudanças de tendência.
Riscos da Estratégia
- Risco de Atraso: Devido ao uso de detecção de pontos de inflexão, a estratégia apresenta um risco inerente de atraso, podendo não capturar os sinais mais precoces da tendência.
- Risco de Mercado Lateralizado: Em mercados com flutuações pouco claras, pequenas variações frequentes de preço podem levar a negociações desnecessárias.
- Sensibilidade a Parâmetros: A escolha do parâmetro
pivotLookbackimpacta significativamente o desempenho da estratégia, exigindo ajustes para diferentes mercados e prazos. - Custos de Negociação: Negociações frequentes podem resultar em altos custos de transação, especialmente quando as taxas de corretagem são elevadas.
Direções de Otimização da Estratégia
- Inserir Filtros Adicionais: Combinar indicadores de força da tendência (como o ATR) para filtrar sinais de tendências fracas.
- Ajuste Dinâmico de Parâmetros: Desenvolver um mecanismo adaptativo para o parâmetro
pivotLookbackbaseado na volatilidade do mercado. - Validação em Múltiplos Prazos: Cruzar sinais de tendência em diferentes prazos para aumentar a confiabilidade dos sinais.
- Aprimoramento com Machine Learning: Explorar o uso de algoritmos de aprendizado de máquina para otimizar a identificação de tendências e o timing de entrada.
- Otimização da Gestão de Risco: Ajustar dinamicamente as distâncias de stop-loss e take-profit de acordo com a volatilidade do mercado.
Resumo
A Estratégia de Momentum Adaptativo com Base na Teoria de Dow é um método poderoso de acompanhamento de tendências. Através de uma técnica inovadora de análise de pontos de inflexão, oferece aos traders uma ferramenta sistemática de identificação de tendências. Apesar de alguns riscos inerentes, sua flexibilidade e natureza dinâmica a tornam uma abordagem valiosa no contexto das estratégias modernas de negociação quantitativa. A aplicação bem-sucedida desta estratégia requer um entendimento profundo de seu funcionamento e ajustes contínuos com base nas condições específicas do mercado.
- Introduzir Filtros Adicionais: Combinar indicadores de força de tendência (como o ATR) para filtrar sinais de tendência fraca.
- Ajuste Dinâmico de Parâmetros: Desenvolver um mecanismo de parâmetro pivotLookback adaptativo com base na volatilidade do mercado.
- Verificação em Múltiplos Timeframes: Cruzar sinais de tendência em diferentes períodos para melhorar a confiabilidade dos sinais.
- Aprimoramento com Machine Learning: Explorar o uso de algoritmos de aprendizado de máquina para otimizar a identificação de tendências e o timing de entrada.
- Otimização da Gestão de Risco: Ajustar dinamicamente as distâncias de stop-loss e take-profit com base na volatilidade do mercado.
Conclusão
A Estratégia de Momentum Adaptativo baseada na Teoria de Dow é um poderoso método seguidor de tendências que oferece aos traders uma ferramenta sistemática de identificação de tendências por meio de técnicas inovadoras de análise de pontos de inflexão. Apesar de alguns riscos inerentes, sua flexibilidade e dinamismo a tornam uma abordagem valiosa nas estratégias modernas de negociação quantitativa. Aplicar esta estratégia com sucesso exige um profundo entendimento de seus princípios de funcionamento e uma contínua otimização e ajuste com base em ambientes de mercado específicos.
/*backtest
start: 2025-03-29 00:00:00
end: 2025-03-30 09:00:00
period: 2m
basePeriod: 2m
exchanges: [{"eid":"Futures_Binance","currency":"BNB_USDT"}]
*/

//@version=5
// strategy(title="Dow Theory Trend Strategy v3", shorttitle="Dow Trend Strat v3", overlay=true,
//      initial_capital=10000, default_qty_type=strategy.percent_of_equity, default_qty_value=10,
// commission_type=strategy.commission.percent, commission_value=0.1, // Example strategy settings with commission- 1