Estratégia de negociação de momentum de salto de média móvel exponencial dupla

EMA SL TP R:R 趋势一致性 反弹交易 动量交易 风险管理 蜡烛图形态
Data de criação: 2025-06-03 10:59:06 última modificação: 2025-06-03 10:59:06
cópia: 0 Cliques: 281
2
focar em
319
Seguidores

Estratégia de negociação de momentum de salto de média móvel exponencial dupla Estratégia de negociação de momentum de salto de média móvel exponencial dupla

Visão geral

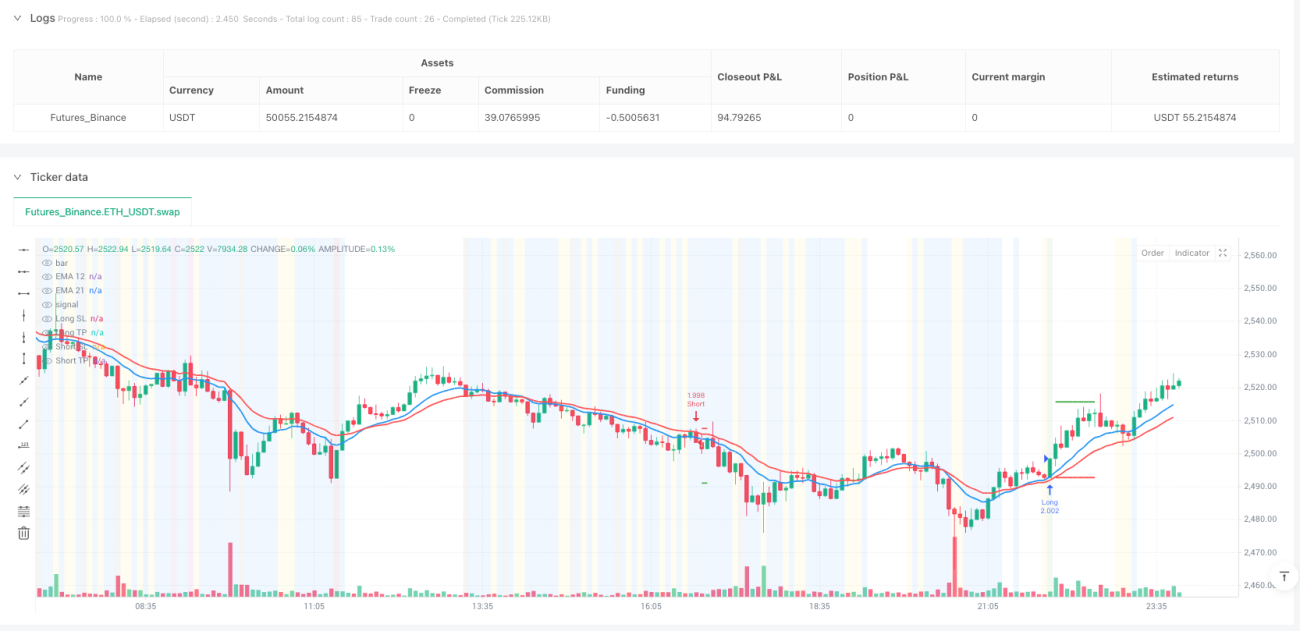
Esta estratégia utiliza os preços que se formam em uma média móvel binária (EMA) para identificar oportunidades de reversão com alta probabilidade. Não é uma estratégia simples de atravessar a média, mas sim um momento para procurar um rebote dos preços da banda EMA e formar uma forte dinâmica. A estratégia usa EMAs de 12 e 21 ciclos para construir um intervalo de negociação e combina o padrão gráfico, a consistência da tendência e um sistema de gerenciamento de risco preciso para capturar a dinâmica do mercado.

Princípio da estratégia

O princípio central da estratégia é procurar sinais de entrada identificando situações em que o preço se rebote com a EMA. Ela usa EMAs de 12 e 21 ciclos para criar faixas de negociação para cima e para baixo, determinando a direção da tendência do mercado com base na posição relativa da EMA.

Quando o EMA12 > EMA21 está em um ambiente de baixa (a faixa verde), buscamos oportunidades para fazer várias coisas. As condições para fazer várias coisas incluem: a linha de baixa do preço tocar a faixa EMA, formando uma forte tendência de baixa (a entidade é maior do que a linha de baixa), a linha de alta é minimizada (menos de 2% da faixa de baixa), o preço de fechamento é maior do que os dois EMAs, a linha anterior não está abaixo da faixa de baixa, e várias correntes consecutivas mantêm a consistência da tendência de baixa.

Quando a EMA12 < EMA21, o mercado está em um ambiente de baixa (a faixa vermelha), procuramos oportunidades de shorting. As condições de shorting incluem: a linha de cima do preço toca a faixa EMA, formando uma forte linha de baixa (a entidade é maior que a linha de cima da sombra), a linha de baixo é minimizada (menos de 2% da faixa de coluna), o preço de fechamento está abaixo das duas EMAs, a linha anterior não foi fechada acima da faixa de cima, e várias raízes consecutivas mantêm a consistência da tendência de baixa.

A estratégia incorpora um sistema de gerenciamento de risco com uma taxa de retorno de risco fixa, com um padrão de 3: 1, o stop loss é configurado no ponto mais alto/mais baixo da coluna anterior, e o stop loss é calculado automaticamente de acordo com a taxa de retorno de risco.

Vantagens estratégicas

A estratégia tem várias vantagens significativas:

  1. Potencial de alta probabilidade de sucesso: a estratégia é capaz de identificar oportunidades de negociação com alta probabilidade de sucesso, capturando a forte dinâmica de mercado após o rebote da faixa EMA.

  2. Regras claras de entrada e saída: A estratégia fornece condições claras de negociação, reduzindo o impacto do julgamento subjetivo e da decisão emocional.

  3. Excelente gerenciamento de risco: o risco de cada transação é controlado com um índice de retorno de risco fixo e um parâmetro de parada automático.

  4. A tendência segue a vantagem: a estratégia consiste em negociar apenas na direção dominante da tendência, evitando o alto risco de uma operação contracorrente.

  5. Aplicável em vários períodos de tempo: a estratégia funciona de forma eficaz em vários períodos de tempo, oferecendo opções de negociação flexíveis.

  6. Sistema de alerta completo: função de alerta de sinais de negociação detalhados, para garantir que você não perca a oportunidade de negociar.

  7. Auxílio visual: mostra intuitivamente os sinais de negociação e o estado dos termos através de mudanças de cor de fundo e dicas de etiquetas.

Risco estratégico

Apesar da estratégia ser bem concebida, existem os seguintes riscos potenciais:

  1. Risco de mercado em choque: em mercados de travessia ou de choque, as faixas EMA podem se tornar apertadas, gerando sinais frequentes, mas de baixa qualidade, resultando em perdas contínuas.

  2. Risco de queda em alta: o mercado pode subir após uma notícia ou evento importante, o que invalida o ponto de parada e causa perdas acima do esperado.

  3. Parâmetros de otimização excessiva: Parâmetros de estratégia de otimização excessiva podem causar curva de ajuste, fazendo com que a estratégia não funcione bem em negociações em disco.

  4. Atraso na identificação de tendências: A EMA, como um indicador de atraso, pode reagir lentamente nos pontos de mudança de tendência, resultando em perda do melhor ponto de entrada ou atraso na saída.

  5. Risco de suspensão de perda: o ruído do mercado pode levar o preço a voltar para a direção esperada após a suspensão de perda, causando perdas desnecessárias.

Os métodos de solução incluem: pausa de negociação em mercados de turbulência; uso de filtros de taxa de flutuação para evitar sinais de baixa qualidade; confirmação de tendências em combinação com outros indicadores; medição periódica e otimização de parâmetros; consideração do uso de tracking stop loss.

Direção de otimização da estratégia

A estratégia pode ser otimizada em várias direções:

  1. Gerenciamento de risco dinâmico: ajuste automático do índice de retorno do risco e do tamanho da posição de acordo com a volatilidade do mercado, reduzindo a abertura de risco em um ambiente de alta volatilidade.

  2. Introdução de filtros de alto nível: Combinação do indicador ATR para filtrar os sinais de baixa flutuação; Adição da confirmação de volume de transação para verificar a eficácia do rebote do preço.

  3. Análise de múltiplos períodos de tempo: a integração da direção da tendência de períodos de tempo mais elevados como condição de filtragem adicional, só é adotada quando as tendências de vários períodos de tempo coincidem.

  4. Otimização de aprendizagem de máquina: ajuste dinâmico de parâmetros usando algoritmos de aprendizagem de máquina, adaptando-se ao melhor conjunto de parâmetros de acordo com diferentes ambientes de mercado.

  5. Realização de tracking stop loss: Após o lucro atingir um determinado nível, o mecanismo de tracking stop loss é implementado, bloqueando parte do lucro e permitindo que a tendência continue.

  6. Estratégia de lucro parcial: implementação de estratégias de lucro em lotes, redução gradual da posição em diferentes preços-alvo, otimização do desempenho do retorno do risco geral.

Essas orientações de otimização podem melhorar a robustez, a adaptabilidade e a rentabilidade de longo prazo das estratégias.

Resumir

A estratégia de negociação de movimentação de linhas de equilíbrio binário é um sistema de negociação integrado que combina análise técnica, identificação de padrões gráficos e gestão rigorosa de risco. Captura oportunidades de mercado com uma dinâmica explosiva, identificando um ponto de reversão de alta probabilidade de um preço que rebote da banda EMA. O principal benefício da estratégia reside em suas regras de negociação claras, seu quadro de retorno de risco definido e seus requisitos de consistência de tendências, o que a torna adequada para todos os tipos de ambientes de mercado e períodos de tempo.

Apesar de alguns riscos potenciais, os comerciantes podem melhorar ainda mais a solidez e a rentabilidade da estratégia através da implementação de medidas de otimização recomendadas. A estratégia é especialmente adequada para os comerciantes que buscam uma forma de negociação sistemática, disciplinada e com risco controlado, e pode beneficiar tanto os investidores de curta linha quanto os de médio e longo prazo.
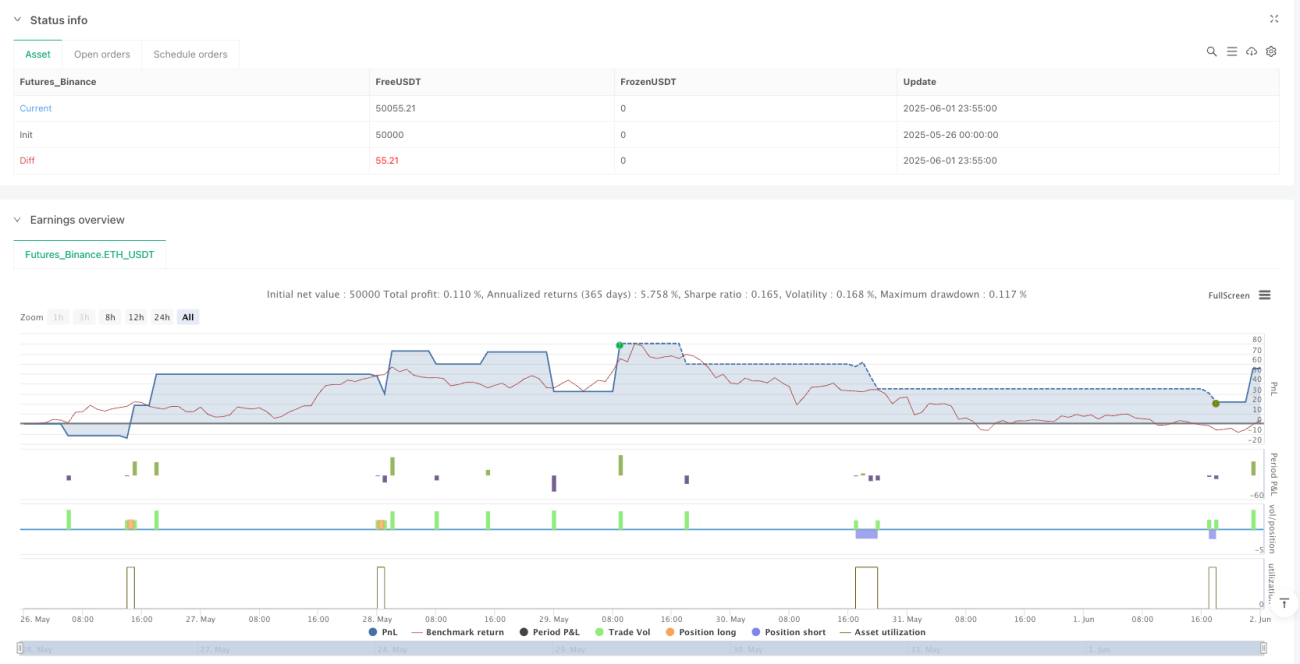
Código-fonte da estratégia
/*backtest
start: 2025-05-26 00:00:00
end: 2025-06-02 00:00:00
period: 5m
basePeriod: 5m
exchanges: [{"eid":"Futures_Binance","currency":"ETH_USDT"}]
*/

//@version=5
strategy("Enhanced EMA Band Rejection Strategy", overlay=true, initial_capital=10000, default_qty_type=strategy.percent_of_equity, default_qty_value=10)

// Input parameters
ema12_length = input.int(12, title="EMA 12 Length")
ema21_length = input.int(21, title="EMA 21 Length")
max_wick_percent = input.float(2.0, title="Max Wick % at High/Low", minval=0.0, maxval=10.0)
risk_reward_ratio = input.float(3.0, title="Risk/Reward Ratio (R)", minval=1.0, maxval=10.0)
trend_consistency_bars = input.int(5, title="Trend Consistency Required (Bars)", minval=1, maxval=20)

// Notification Settings
enable_notifications = input.bool(true, title="Enable Notifications", group="Notifications")
notify_on_entry = input.bool(true, title="Notify on Trade Entry", group="Notifications")
notify_on_exit = input.bool(true, title="Notify on Trade Exit", group="Notifications")
notify_on_setup = input.bool(false, title="Notify on Potential Setup (Pre-Entry)", group="Notifications")
notify_on_failed_conditions = input.bool(false, title="Notify on Failed Conditions", group="Notifications")

// Calculate EMAs
ema12 = ta.ema(close, ema12_length)
ema21 = ta.ema(close, ema21_length)

// Determine upper and lower EMA bands
ema_upper = math.max(ema12, ema21)
ema_lower = math.min(ema12, ema21)

// Plot EMAs
plot(ema12, color=color.blue, linewidth=2, title="EMA 12")
plot(ema21, color=color.red, linewidth=2, title="EMA 21")

// Calculate candle components
body_size = math.abs(close - open)
upper_wick = high - math.max(open, close)
lower_wick = math.min(open, close) - low
candle_range = high - low

// Calculate wick percentages
upper_wick_percent = candle_range > 0 ? (upper_wick / candle_range) * 100 : 0
lower_wick_percent = candle_range > 0 ? (lower_wick / candle_range) * 100 : 0

// Determine EMA trend direction
ema_bullish = ema12 > ema21  // Green bands - bullish trend
ema_bearish = ema12 < ema21  // Red bands - bearish trend

// Check trend consistency for required number of bars
bullish_consistency_check = true
bearish_consistency_check = true

for i = 0 to trend_consistency_bars - 1
    ema12_past = ta.ema(close[i], ema12_length)
    ema21_past = ta.ema(close[i], ema21_length)
    if ema12_past <= ema21_past
        bullish_consistency_check := false
    if ema12_past >= ema21_past
        bearish_consistency_check := false

// Final trend conditions with consistency requirement
ema_bullish_consistent = ema_bullish and bullish_consistency_check
ema_bearish_consistent = ema_bearish and bearish_consistency_check

// NEW RULE: Previous candle close position relative to bands
prev_close_above_upper_band = close[1] > ema_upper[1]
prev_close_below_lower_band = close[1] < ema_lower[1]
prev_close_within_bands = close[1] >= ema_lower[1] and close[1] <= ema_upper[1]

// Long setup conditions (only when EMAs are bullish/green consistently)
long_wick_condition = low <= ema_lower or (low <= ema_upper and low >= ema_lower)
long_body_condition = body_size >= lower_wick
long_wick_percent_condition = upper_wick_percent <= max_wick_percent
long_bullish_candle = close > open
long_trend_condition = ema_bullish_consistent  // Only long when bands are consistently green
long_close_above_bands = close > ema_upper  // NEW: Close must be above both EMAs
// Previous candle must not have closed below the lower band
long_prev_close_condition = not prev_close_below_lower_band
long_setup = long_wick_condition and long_body_condition and long_wick_percent_condition and long_bullish_candle and long_trend_condition and long_close_above_bands and long_prev_close_condition

// Short setup conditions (only when EMAs are bearish/red consistently)
short_wick_condition = high >= ema_upper or (high >= ema_lower and high <= ema_upper)
short_body_condition = body_size >= upper_wick
short_wick_percent_condition = lower_wick_percent <= max_wick_percent
short_bearish_candle = close < open
short_trend_condition = ema_bearish_consistent  // Only short when bands are consistently red
short_close_below_bands = close < ema_lower  // NEW: Close must be below both EMAs
// Previous candle must not have closed above the upper band
short_prev_close_condition = not prev_close_above_upper_band
short_setup = short_wick_condition and short_body_condition and short_wick_percent_condition and short_bearish_candle and short_trend_condition and short_close_below_bands and short_prev_close_condition

// Entry conditions
var float long_sl = na
var float short_sl = na
var float long_tp = na
var float short_tp = na

if long_setup and strategy.position_size == 0
    strategy.entry("Long", strategy.long)
    long_sl := low
    risk_amount = close - long_sl
    long_tp := close + (risk_amount * risk_reward_ratio)
    label.new(bar_index, low, "LONG", style=label.style_label_up, color=color.green, size=size.small)
    
    // Entry Notification
    if enable_notifications and notify_on_entry
        alert("🟢 LONG ENTRY SIGNAL\n" + 
              "Symbol: " + syminfo.ticker + "\n" + 
              "Price: " + str.tostring(close, "#.####") + "\n" + 
              "Stop Loss: " + str.tostring(long_sl, "#.####") + "\n" + 
              "Take Profit: " + str.tostring(long_tp, "#.####") + "\n" + 
              "Risk/Reward: " + str.tostring(risk_reward_ratio, "#.##") + "R\n" + 
              "Time: " + str.tostring(time), alert.freq_once_per_bar)

if short_setup and strategy.position_size == 0
    strategy.entry("Short", strategy.short)
    short_sl := high
    risk_amount = short_sl - close
    short_tp := close - (risk_amount * risk_reward_ratio)
    label.new(bar_index, high, "SHORT", style=label.style_label_down, color=color.red, size=size.small)
    
    // Entry Notification
    if enable_notifications and notify_on_entry
        alert("🔴 SHORT ENTRY SIGNAL\n" + 
              "Symbol: " + syminfo.ticker + "\n" + 
              "Price: " + str.tostring(close, "#.####") + "\n" + 
              "Stop Loss: " + str.tostring(short_sl, "#.####") + "\n" + 
              "Take Profit: " + str.tostring(short_tp, "#.####") + "\n" + 
              "Risk/Reward: " + str.tostring(risk_reward_ratio, "#.##") + "R\n" + 
              "Time: " + str.tostring(time), alert.freq_once_per_bar)

// Exit conditions with fixed R:R
if strategy.position_size > 0
    // Long position - fixed stop loss and take profit
    strategy.exit("Long Exit", "Long", stop=long_sl, limit=long_tp)
    
    // Exit Notifications
    if enable_notifications and notify_on_exit
        if close <= long_sl
            alert("🛑 LONG STOP LOSS HIT\n" + 
                  "Symbol: " + syminfo.ticker + "\n" + 
                  "Exit Price: " + str.tostring(close, "#.####") + "\n" + 
                  "Loss: " + str.tostring(close - strategy.position_avg_price, "#.####") + "\n" + 
                  "Time: " + str.tostring(time), alert.freq_once_per_bar)
        if close >= long_tp
            alert("🎯 LONG TAKE PROFIT HIT\n" + 
                  "Symbol: " + syminfo.ticker + "\n" + 
                  "Exit Price: " + str.tostring(close, "#.####") + "\n" + 
                  "Profit: " + str.tostring(close - strategy.position_avg_price, "#.####") + "\n" + 
                  "Time: " + str.tostring(time), alert.freq_once_per_bar)

if strategy.position_size < 0
    // Short position - fixed stop loss and take profit
    strategy.exit("Short Exit", "Short", stop=short_sl, limit=short_tp)
    
    // Exit Notifications
    if enable_notifications and notify_on_exit
        if close >= short_sl
            alert("🛑 SHORT STOP LOSS HIT\n" + 
                  "Symbol: " + syminfo.ticker + "\n" + 
                  "Exit Price: " + str.tostring(close, "#.####") + "\n" + 
                  "Loss: " + str.tostring(strategy.position_avg_price - close, "#.####") + "\n" + 
                  "Time: " + str.tostring(time), alert.freq_once_per_bar)
        if close <= short_tp
            alert("🎯 SHORT TAKE PROFIT HIT\n" + 
                  "Symbol: " + syminfo.ticker + "\n" + 
                  "Exit Price: " + str.tostring(close, "#.####") + "\n" + 
                  "Profit: " + str.tostring(strategy.position_avg_price - close, "#.####") + "\n" + 
                  "Time: " + str.tostring(time), alert.freq_once_per_bar)

// Plot stop levels and take profit levels
plot(strategy.position_size > 0 ? long_sl : na, color=color.red, linewidth=2, style=plot.style_line, title="Long SL")
plot(strategy.position_size < 0 ? short_sl : na, color=color.red, linewidth=2, style=plot.style_line, title="Short SL")
plot(strategy.position_size > 0 ? long_tp : na, color=color.green, linewidth=2, style=plot.style_line, title="Long TP")
plot(strategy.position_size < 0 ? short_tp : na, color=color.green, linewidth=2, style=plot.style_line, title="Short TP")

// Additional Notification Logic
// Potential Setup Notifications (when most conditions are met but not all)
long_potential_setup = long_wick_condition and long_body_condition and long_wick_percent_condition and long_bullish_candle and long_trend_condition and long_prev_close_condition and not long_close_above_bands
short_potential_setup = short_wick_condition and short_body_condition and short_wick_percent_condition and short_bearish_candle and short_trend_condition and short_prev_close_condition and not short_close_below_bands

if enable_notifications and notify_on_setup and strategy.position_size == 0
    if long_potential_setup
        alert("⚠️ POTENTIAL LONG SETUP\n" + 
              "Symbol: " + syminfo.ticker + "\n" + 
              "Price: " + str.tostring(close, "#.####") + "\n" + 
              "Status: Close needs to be above " + str.tostring(ema_upper, "#.####") + "\n" + 
              "Current Close: " + str.tostring(close, "#.####") + "\n" + 
              "Time: " + str.tostring(time), alert.freq_once_per_bar)
    
    if short_potential_setup
        alert("⚠️ POTENTIAL SHORT SETUP\n" + 
              "Symbol: " + syminfo.ticker + "\n" + 
              "Price: " + str.tostring(close, "#.####") + "\n" + 
              "Status: Close needs to be below " + str.tostring(ema_lower, "#.####") + "\n" + 
              "Current Close: " + str.tostring(close, "#.####") + "\n" + 
              "Time: " + str.tostring(time), alert.freq_once_per_bar)

// Failed Conditions Notifications (for debugging)
if enable_notifications and notify_on_failed_conditions and strategy.position_size == 0
    if long_wick_condition and long_body_condition and long_wick_percent_condition and long_bullish_candle and not long_trend_condition
        alert("❌ LONG SETUP FAILED\n" + 
              "Symbol: " + syminfo.ticker + "\n" + 
              "Reason: " + (not ema_bullish ? "EMA trend bearish" : "EMA trend not consistent") + "\n" + 
              "EMA12: " + str.tostring(ema12, "#.####") + "\n" + 
              "EMA21: " + str.tostring(ema21, "#.####") + "\n" + 
              "Time: " + str.tostring(time), alert.freq_once_per_bar)
    
    if short_wick_condition and short_body_condition and short_wick_percent_condition and short_bearish_candle and not short_trend_condition
        alert("❌ SHORT SETUP FAILED\n" + 
              "Symbol: " + syminfo.ticker + "\n" + 
              "Reason: " + (not ema_bearish ? "EMA trend bullish" : "EMA trend not consistent") + "\n" + 
              "EMA12: " + str.tostring(ema12, "#.####") + "\n" + 
              "EMA21: " + str.tostring(ema21, "#.####") + "\n" + 
              "Time: " + str.tostring(time), alert.freq_once_per_bar)
bgcolor(long_setup ? color.new(color.green, 90) : na, title="Long Setup")
bgcolor(short_setup ? color.new(color.red, 90) : na, title="Short Setup")
// Show when previous close condition fails
bgcolor(long_wick_condition and long_body_condition and long_wick_percent_condition and long_bullish_candle and long_trend_condition and prev_close_below_lower_band ? color.new(color.orange, 95) : na, title="Long Rejected by Prev Close")
bgcolor(short_wick_condition and short_body_condition and short_wick_percent_condition and short_bearish_candle and short_trend_condition and prev_close_above_upper_band ? color.new(color.orange, 95) : na, title="Short Rejected by Prev Close")

// Detailed debugging for failed conditions
long_all_conditions_except_prev = long_wick_condition and long_body_condition and long_wick_percent_condition and long_bullish_candle and long_trend_condition and long_close_above_bands
bgcolor(long_all_conditions_except_prev and prev_close_below_lower_band ? color.new(color.purple, 90) : na, title="Long Failed: Prev Close Below Band")
bgcolor(long_wick_condition and not long_body_condition ? color.new(color.yellow, 90) : na, title="Long Failed: Body Too Small")
bgcolor(long_wick_condition and long_body_condition and not long_wick_percent_condition ? color.new(color.blue, 90) : na, title="Long Failed: Upper Wick Too Big")
bgcolor(long_wick_condition and long_body_condition and long_wick_percent_condition and not long_bullish_candle ? color.new(color.gray, 90) : na, title="Long Failed: Not Bullish Candle")
bgcolor(long_wick_condition and long_body_condition and long_wick_percent_condition and long_bullish_candle and ema_bullish and not ema_bullish_consistent ? color.new(color.fuchsia, 90) : na, title="Long Failed: Trend Not Consistent")
bgcolor(long_wick_condition and long_body_condition and long_wick_percent_condition and long_bullish_candle and not ema_bullish ? color.new(color.maroon, 90) : na, title="Long Failed: EMA Trend Bearish")
bgcolor(long_wick_condition and long_body_condition and long_wick_percent_condition and long_bullish_candle and long_trend_condition and not long_close_above_bands ? color.new(color.lime, 90) : na, title="Long Failed: Close Not Above Bands")

// Similar debugging for shorts
short_all_conditions_except_prev = short_wick_condition and short_body_condition and short_wick_percent_condition and short_bearish_candle and short_trend_condition and short_close_below_bands
bgcolor(short_all_conditions_except_prev and prev_close_above_upper_band ? color.new(color.purple, 90) : na, title="Short Failed: Prev Close Above Band")
bgcolor(short_wick_condition and short_body_condition and short_wick_percent_condition and short_bearish_candle and short_trend_condition and not short_close_below_bands ? color.new(color.aqua, 90) : na, title="Short Failed: Close Not Below Bands")

// Enhanced table for debugging
if barstate.islast
    var table debug_table = table.new(position.top_right, 2, 19, bgcolor=color.white, border_width=1)
    table.cell(debug_table, 0, 0, "Condition", text_color=color.black, bgcolor=color.gray)
    table.cell(debug_table, 1, 0, "Value", text_color=color.black, bgcolor=color.gray)
    table.cell(debug_table, 0, 1, "Body Size", text_color=color.black)
    table.cell(debug_table, 1, 1, str.tostring(body_size, "#.##"), text_color=color.black)
    table.cell(debug_table, 0, 2, "Upper Wick", text_color=color.black)
    table.cell(debug_table, 1, 2, str.tostring(upper_wick, "#.##"), text_color=color.black)
    table.cell(debug_table, 0, 3, "Lower Wick", text_color=color.black)
    table.cell(debug_table, 1, 3, str.tostring(lower_wick, "#.##"), text_color=color.black)
    table.cell(debug_table, 0, 4, "Upper Wick %", text_color=color.black)
    table.cell(debug_table, 1, 4, str.tostring(upper_wick_percent, "#.##") + "%", text_color=color.black)
    table.cell(debug_table, 0, 5, "Lower Wick %", text_color=color.black)
    table.cell(debug_table, 1, 5, str.tostring(lower_wick_percent, "#.##") + "%", text_color=color.black)
    table.cell(debug_table, 0, 6, "EMA Upper", text_color=color.black)
    table.cell(debug_table, 1, 6, str.tostring(ema_upper, "#.##"), text_color=color.black)
    table.cell(debug_table, 0, 7, "EMA Lower", text_color=color.black)
    table.cell(debug_table, 1, 7, str.tostring(ema_lower, "#.##"), text_color=color.black)
    table.cell(debug_table, 0, 8, "R:R Ratio", text_color=color.black)
    table.cell(debug_table, 1, 8, str.tostring(risk_reward_ratio, "#.##") + "R", text_color=color.black)
    table.cell(debug_table, 0, 9, "Position", text_color=color.black)
    table.cell(debug_table, 1, 9, strategy.position_size > 0 ? "LONG" : strategy.position_size < 0 ? "SHORT" : "NONE", text_color=color.black)
    // NEW DEBUG INFO
    table.cell(debug_table, 0, 10, "Prev Close", text_color=color.black)
    table.cell(debug_table, 1, 10, str.tostring(close[1], "#.##"), text_color=color.black)
    table.cell(debug_table, 0, 11, "Prev Above Upper", text_color=color.black)
    table.cell(debug_table, 1, 11, prev_close_above_upper_band ? "YES" : "NO", text_color=color.black)
    table.cell(debug_table, 0, 12, "Prev Below Lower", text_color=color.black)
    table.cell(debug_table, 1, 12, prev_close_below_lower_band ? "YES" : "NO", text_color=color.black)
    table.cell(debug_table, 0, 13, "Prev Within Bands", text_color=color.black)
    table.cell(debug_table, 1, 13, prev_close_within_bands ? "YES" : "NO", text_color=color.black)
    // NEW: Trend consistency info
    table.cell(debug_table, 0, 14, "Bullish Consistent", text_color=color.black)
    table.cell(debug_table, 1, 14, ema_bullish_consistent ? "YES" : "NO", text_color=color.black)
    table.cell(debug_table, 0, 15, "Bearish Consistent", text_color=color.black)
    table.cell(debug_table, 1, 15, ema_bearish_consistent ? "YES" : "NO", text_color=color.black)
    table.cell(debug_table, 0, 16, "Consistency Bars", text_color=color.black)
    table.cell(debug_table, 1, 16, str.tostring(trend_consistency_bars), text_color=color.black)
    // NEW: Close position relative to bands
    table.cell(debug_table, 0, 17, "Close Above Upper", text_color=color.black)
    table.cell(debug_table, 1, 17, close > ema_upper ? "YES" : "NO", text_color=color.black)
    table.cell(debug_table, 0, 18, "Close Below Lower", text_color=color.black)
    table.cell(debug_table, 1, 18, close < ema_lower ? "YES" : "NO", text_color=color.black)