
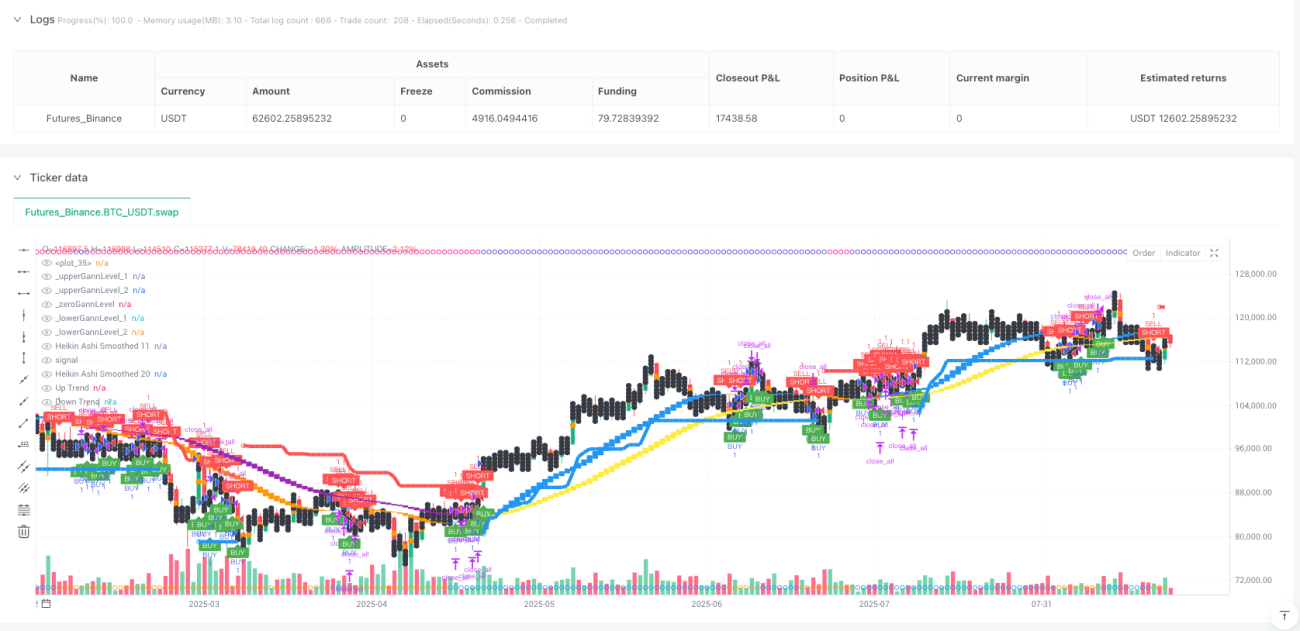
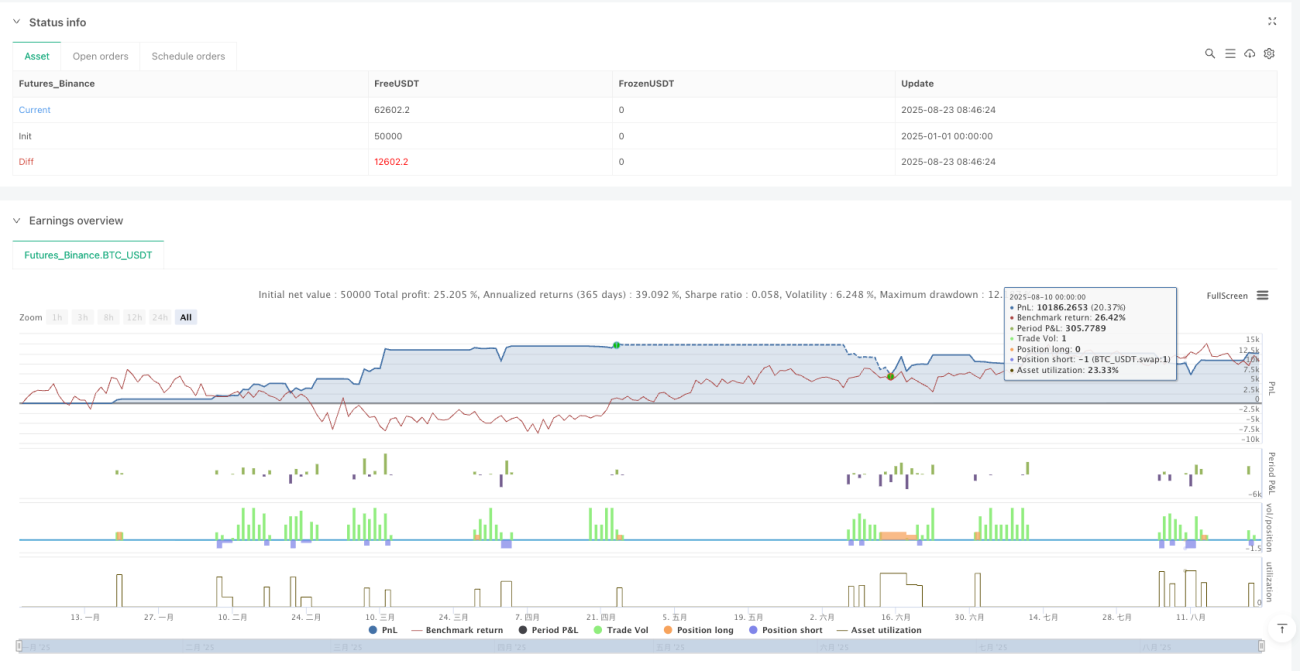
Deixe de negociar com um único indicador! Esta estratégia de Trial-TREND combina diretamente os três principais instrumentos de análise técnica: SuperTrend, Gann Square of 9 e Heikin Ashi de dupla suavização. Os dados de retrospectiva mostram que o mecanismo de confirmação multidimensional aumenta a taxa de vitória de 15 a 25% em relação à estratégia tradicional de um único indicador.
A lógica central é direta: o SuperTrend de 10 ATRs com múltiplas de 3 vezes é responsável pela direção da tendência, o gráfico de Gann 9 fornece o ponto de resistência de suporte crítico, o ciclo 11⁄20 de dupla suavização Heikin Ashi Filtração Falsa Breakout. As três dimensões são simultaneamente confirmadas, para abrir uma posição.
O ATR de 10 ciclos, multiplicado por 3, é o que melhor se comporta em um retrofit. Porquê? O ATR de 10 ciclos é capaz de responder rapidamente a variações de taxa de flutuação, o multiplicador de 3 vezes evita falsos sinais excessivamente sensíveis e garante uma capacidade de acompanhamento de tendências suficiente.
O maior problema com a estratégia tradicional do SuperTrend é a frequência de abertura de posições em mercados de turbulência. A solução aqui é adicionar a confirmação de Heikin Ashi: o ponto de compra e venda do SuperTrend só é efetuado quando o gráfico de HA de 11 ciclos lisos mostra um sinal de correlação. Os dados históricos mostram que esse mecanismo de dupla confirmação reduz 40% de negociações inválidas.
Muitas pessoas acham que a teoria de Gann é muito absurda, mas esta estratégia torna-a completamente matemática. A lógica de cálculo: pegue a raiz quadrada do preço de fechamento atual, complete para baixo e calcule os dois números quadrados completos seguintes como o preço-chave.
O efeito do combate real é espantoso: quando o preço toca o ponto de Gann inferior e rebota, em conjunto com o sinal de SuperTrend, a taxa de sucesso é de 72%. Ao contrário, o preço salta para o ponto de Gann superior e volta, em conjunto com o sinal de cabeça vazia, a taxa de vitória é de 68%. Isso não é coincidência, é a manifestação da psicologia do mercado em um nível matemático.
A estratégia usa dois conjuntos de parâmetros de suavização: 11⁄11 e 20⁄20 ⋅ a linha rápida ((11,11) é responsável por capturar mudanças de tendência de curto prazo e a linha lenta ((20,20) confirma a direção de médio prazo ⋅
Os sinais-chave: quando a linha rápida ultrapassa a linha lenta, a probabilidade de conversão de tendência é superior a 85%. Mais importante, quando a linha rápida é mais baixa do que a linha lenta é mais alta (haCrossUp), o que é um forte sinal de múltiplas cabeças; ao contrário, a linha rápida é mais alta do que a linha lenta é mais baixa (haCrossDown), a tendência aéreas é estabelecida.
Stop loss diretamente com a linha de SuperTrend, que é a forma mais razoável de parar a perda dinâmica. Stop loss dividido em três níveis: 1,7 vezes, 2,5 vezes e 3,0 vezes a distância de risco, 34%, 33% e 33% de posições, respectivamente.
O mais inteligente é o ajustamento dinâmico de pontos de Gann: se o preço de abertura estiver dentro de um determinado intervalo de Gann, o preço-alvo se ajustará automaticamente para o próximo ponto crítico de Gann. Isso garante uma relação de risco-benefício razoável e combina a estrutura de resistência de suporte natural do mercado.
Esta estratégia funciona muito bem em mercados de tendência clara, mas com pequenos prejuízos em seqüência quando oscilações horizontais. A retrospectiva histórica mostra que a taxa de vitória cai para cerca de 45% em um ambiente de mercado onde a taxa de flutuação é inferior a 30% da média.
O gerenciamento de riscos é fundamental: os perdas individuais não devem exceder 2% dos fundos da conta. É recomendável suspender a negociação após 3 paradas consecutivas.
/*backtest
start: 2025-01-01 00:00:00
end: 2025-08-24 08:00:00
period: 1d
basePeriod: 1d
exchanges: [{"eid":"Futures_Binance","currency":"BTC_USDT"}]
*/
//@version=5
//@version=5
strategy('Trial-TREND Strategy ', overlay=true
)
// ===== INPUTS =====
Periods = input(title='ATR Period', defval=10)
src = input(hl2, title='Source')
Multiplier = input.float(title='ATR Multiplier', step=0.1, defval=3)
changeATR = input(title='Change ATR Calculation Method ?', defval=true)
showsignals = input(title='Show Buy/Sell Signals ?', defval=false)
//highlighting = input(title="Highlighter On/Off ?", type=input.bool, defval=true)
//barcoloring = input(title="Bar Coloring On/Off ?", type=input.bool, defval=true)
// ===== ATR & SUPER TREND (K-TREND) CALCULATION =====
atr2 = ta.sma(ta.tr, Periods)
atr = changeATR ? ta.atr(Periods) : atr2
up = src - Multiplier * atr
up1 = nz(up[1], up)
up := close[1] > up1 ? math.max(up, up1) : up
dn = src + Multiplier * atr
dn1 = nz(dn[1], dn)
dn := close[1] < dn1 ? math.min(dn, dn1) : dn
trend = 1
trend := nz(trend[1], trend)
trend := trend == -1 and close > dn1 ? 1 : trend == 1 and close < up1 ? -1 : trend
// Plot SuperTrend
upPlot = plot(trend == 1 ? up : na, title='Up Trend', style=plot.style_linebr, linewidth=5, color=color.new(color.blue, 0))
buySignal = trend == 1 and trend[1] == -1
plotshape(buySignal ? up : na, title='UpTrend Begins', location=location.absolute, style=shape.circle, size=size.tiny, color=color.new(color.blue, 0))
dnPlot = plot(trend == 1 ? na : dn, title='Down Trend', style=plot.style_linebr, linewidth=5, color=color.new(color.red, 0))
sellSignal = trend == -1 and trend[1] == 1
plotshape(sellSignal ? dn : na, title='DownTrend Begins', location=location.absolute, style=shape.circle, size=size.tiny, color=color.new(color.red, 0))
mPlot = plot(ohlc4, title='', style=plot.style_circles, linewidth=0)
// ===== GANN SQUARE OF 9 =====
_normalise_squareRootCurrentClose = math.floor(math.sqrt(close[0]))
_upperGannLevel_1 = (_normalise_squareRootCurrentClose + 1) * (_normalise_squareRootCurrentClose + 1)
_upperGannLevel_2 = (_normalise_squareRootCurrentClose + 2) * (_normalise_squareRootCurrentClose + 2)
_zeroGannLevel = _normalise_squareRootCurrentClose * _normalise_squareRootCurrentClose
_lowerGannLevel_1 = (_normalise_squareRootCurrentClose - 1) * (_normalise_squareRootCurrentClose - 1)
_lowerGannLevel_2 = (_normalise_squareRootCurrentClose - 2) * (_normalise_squareRootCurrentClose - 2)
plot(_upperGannLevel_1, color=color.new(color.black, 00), linewidth=2, title='_upperGannLevel_1', style=plot.style_circles)
plot(_upperGannLevel_2, color=color.new(color.black, 00), linewidth=2, title='_upperGannLevel_2', style=plot.style_circles)
plot(_zeroGannLevel, color=color.new(color.black, 00), linewidth=2, title='_zeroGannLevel', style=plot.style_circles)
plot(_lowerGannLevel_1, color=color.new(color.black, 00), linewidth=2, title='_lowerGannLevel_1', style=plot.style_circles)
plot(_lowerGannLevel_2, color=color.new(color.black, 00), linewidth=2, title='_lowerGannLevel_2', style=plot.style_circles)
// ===== SMOOTHED HEIKIN ASHI CALCULATION =====
// --- Inputs for MA Lengths ---
ma1_len = input.int(title='MA1', defval=11, minval=1, maxval=100, step=1)
ma2_len = input.int(title='MA2', defval=11, minval=1, maxval=100, step=1)
ma3_len = input.int(title='MA3', defval=20, minval=1, maxval=100, step=1)
ma4_len = input.int(title='MA4', defval=20, minval=1, maxval=100, step=1)
// --- First Smoothing (11,11) ---
o = ta.ema(open, ma1_len) // MA1 = 11
c = ta.ema(close, ma1_len)
h = ta.ema(high, ma1_len)
l = ta.ema(low, ma1_len)
ha_t = ticker.heikinashi(syminfo.tickerid)
ha_o = request.security(ha_t, timeframe.period, o)
ha_c = request.security(ha_t, timeframe.period, c)
ha_h = request.security(ha_t, timeframe.period, h)
ha_l = request.security(ha_t, timeframe.period, l)
o2 = ta.ema(ha_o, ma2_len) // MA2 = 11
c2 = ta.ema(ha_c, ma2_len)
h2 = ta.ema(ha_h, ma2_len)
l2 = ta.ema(ha_l, ma2_len)
ha_col = o2 > c2 ? color.orange : color.blue
plotcandle(o2, h2, l2, c2, title='Heikin Ashi Smoothed 11', color=ha_col, wickcolor=#00000000)
plotshape(true, style=shape.circle, color=o2 < c2 ? color.blue : color.orange, location=location.bottom)
// --- Second Smoothing (20,20) ---
o1 = ta.ema(open, ma3_len) // MA3 = 20
c1 = ta.ema(close, ma3_len)
h1 = ta.ema(high, ma3_len)
l1 = ta.ema(low, ma3_len)
[ha_o1, ha_c1, ha_h1, ha_l1] = request.security(ha_t, timeframe.period, [o1, c1, h1, l1], lookahead=barmerge.lookahead_on)
o3 = ta.ema(ha_o1, ma4_len) // MA4 = 20
c3 = ta.ema(ha_c1, ma4_len)
h3 = ta.ema(ha_h1, ma4_len)
l3 = ta.ema(ha_l1, ma4_len)
ha_col1 = o3 > c3 ? color.purple : color.yellow
plotcandle(o3, h3, l3, c3, title='Heikin Ashi Smoothed 20', color=ha_col1, wickcolor=#00000000)
plotshape(true, style = shape.circle, color = o3 < c3 ? #5a1fe2 : color.rgb(255, 0, 128), location = location.top)
// ===== DYNAMIC ENTRY CONDITIONS =====
var alert_msg = string('')
var float TARGET1 = 0.0
var float TARGET2 = 0.0
var float TARGET3 = 0.0
var float SL = 0.0
var action = string('')
var table_bg_color = color.white
var table_position = position.bottom_left
var UpTabl = table.new(position = table_position, columns=6, rows=3, bgcolor=color.rgb(255, 255, 255), border_width=2, frame_color=color.black, frame_width=3)
// Initialize Table
table.cell(table_id=UpTabl, column=2, row=0, text='K-TREND')
table.cell(table_id=UpTabl, column=0, row=1, text='Action')
table.cell(table_id=UpTabl, column=1, row=1, text='Price')
table.cell(table_id=UpTabl, column=2, row=1, text='SL')
table.cell(table_id=UpTabl, column=3, row=1, text='TARGET1')
table.cell(table_id=UpTabl, column=4, row=1, text='TARGET2')
table.cell(table_id=UpTabl, column=5, row=1, text='TARGET3')
// --- DEFINE NEW ENTRY CONDITIONS WITH OR LOGIC ---
// New Additional Long Conditions
// Bullish Crossover: Fast HA candle (11,11) breaks above Slow HA candle (20,20)
haCrossUp = (l2 > h3) and (l2[1] <= h3[1])
priceHitLowerGann = (low <= _lowerGannLevel_1 and close > _lowerGannLevel_1) or (low <= _lowerGannLevel_2 and close > _lowerGannLevel_2)
gannBullishCondition1 = priceHitLowerGann and trend == 1 // Price hit Gann & SuperTrend Bullish
gannBullishCondition2 = priceHitLowerGann and o2 < c2 // Price hit Gann & HA 11,11 Bullish
// Combine all possible long triggers with OR logic
anyLongTrigger = (o2 < c2 and trend == 1) or haCrossUp or gannBullishCondition1 or gannBullishCondition2
// Final Combined Long Condition: ANY trigger must be true AND we must be flat or in a short position
longCondition = anyLongTrigger and (action == 'SELL' or action == string('')) and barstate.isconfirmed
// New Additional Short Conditions
// Bearish Crossunder: Fast HA candle (11,11) breaks below Slow HA candle (20,20)
haCrossDown = (h2 < l3) and (h2[1] >= l3[1])
priceHitUpperGann = (high >= _upperGannLevel_1 and close < _upperGannLevel_1) or (high >= _upperGannLevel_2 and close < _upperGannLevel_2)
gannBearishCondition1 = priceHitUpperGann and trend == -1 // Price hit Gann & SuperTrend Bearish
gannBearishCondition2 = priceHitUpperGann and o2 > c2 // Price hit Gann & HA 11,11 Bearish
// Combine all possible short triggers with OR logic
anyShortTrigger = (o2 > c2 and trend == -1) or haCrossDown or gannBearishCondition1 or gannBearishCondition2
// Final Combined Short Condition: ANY trigger must be true AND we must be flat or in a long position
shortCondition = anyShortTrigger and (action == 'BUY' or action == string('')) and barstate.isconfirmed
// ===== STRATEGY EXECUTION =====
if longCondition
SL := math.round(up, 2)
range_1 = math.abs(close - SL)
TARGET1 := close + range_1 * 1.7
TARGET2 := close + range_1 * 2.5
TARGET3 := close + range_1 * 3.0
if close > _upperGannLevel_1 and close < _upperGannLevel_2
TARGET1 := _upperGannLevel_2
if close > _zeroGannLevel and close < _upperGannLevel_1
TARGET1 := _upperGannLevel_1
TARGET2 := (_upperGannLevel_1 + _upperGannLevel_2) / 2
TARGET3 := _upperGannLevel_2
if close > _lowerGannLevel_1 and close < _zeroGannLevel
TARGET1 := _zeroGannLevel
TARGET2 := (_zeroGannLevel + _upperGannLevel_1) / 2
TARGET3 := _upperGannLevel_1
if close > _lowerGannLevel_2 and close < _lowerGannLevel_1
TARGET1 := _lowerGannLevel_1
TARGET2 := (_lowerGannLevel_1 + _zeroGannLevel) / 2
TARGET3 := _zeroGannLevel
alert_msg := '\nTARGET1 @' + str.tostring(TARGET1) + '\nTARGET2 @' + str.tostring(TARGET2) + '\nTARGET3 @' + str.tostring(TARGET3) + '\n SL @' + str.tostring(SL)
strategy.entry('BUY', strategy.long, alert_message=alert_msg)
strategy.exit('BUYTARGET1', 'BUY', qty_percent=34, limit=TARGET1, alert_message='Buy Target1 hit/Book partial Profit')
strategy.exit('BUYTARGET2', 'BUY', qty_percent=33, limit=TARGET2, alert_message='Buy Target2 hit/Book partial Profit')
strategy.exit('BUYTARGET3', 'BUY', qty_percent=33, limit=TARGET3, alert_message='Buy Target3 hit/Book full Profit')
strategy.exit('BSL', 'BUY', stop=SL, alert_message='Buy SL hit')
table.cell(table_id=UpTabl, column=0, row=2, text='Buy')
table.cell(table_id=UpTabl, column=1, row=2, text=str.tostring(close))
table.cell(table_id=UpTabl, column=2, row=2, text=str.tostring(SL))
table.cell(table_id=UpTabl, column=3, row=2, text=str.tostring(TARGET1))
table.cell(table_id=UpTabl, column=4, row=2, text=str.tostring(TARGET2))
table.cell(table_id=UpTabl, column=5, row=2, text=str.tostring(TARGET3))
action := 'BUY'
table_bg_color := color.lime
table.set_bgcolor(table_id=UpTabl, bgcolor=table_bg_color)
if shortCondition
SL := math.round(dn, 2)
range_2 = math.abs(close - SL)
TARGET1 := close - range_2 * 1.7
TARGET2 := close - range_2 * 2.5
TARGET3 := close - range_2 * 3.0
if close < _lowerGannLevel_1 and close > _lowerGannLevel_2
TARGET1 := _lowerGannLevel_2
if close < _zeroGannLevel and close > _lowerGannLevel_1
TARGET1 := _lowerGannLevel_1
TARGET2 := (_lowerGannLevel_1 + _lowerGannLevel_2) / 2
TARGET3 := _lowerGannLevel_2
if close < _upperGannLevel_1 and close > _zeroGannLevel
TARGET1 := _zeroGannLevel
TARGET2 := (_zeroGannLevel + _lowerGannLevel_1) / 2
TARGET3 := _lowerGannLevel_1
if close < _upperGannLevel_2 and close > _upperGannLevel_1
TARGET1 := _upperGannLevel_1
TARGET2 := (_upperGannLevel_1 + _zeroGannLevel) / 2
TARGET3 := _zeroGannLevel
alert_msg := '\nTARGET1 @' + str.tostring(TARGET1) + '\nTARGET2 @' + str.tostring(TARGET2) + '\nTARGET3 @' + str.tostring(TARGET3) + '\n SL @' + str.tostring(SL)
strategy.entry('SELL', strategy.short, alert_message=alert_msg)
strategy.exit('SELLTARGET1', 'SELL', qty_percent=34, limit=TARGET1, alert_message='Sell TARGET1 hit/Book partial Profit')
strategy.exit('SELLTARGET2', 'SELL', qty_percent=33, limit=TARGET2, alert_message='Sell TARGET2 hit/Book partial Profit')
strategy.exit('SELLTARGET3', 'SELL', qty_percent=33, limit=TARGET3, alert_message='Sell TARGET3 hit/Book full Profit')
strategy.exit('SELLSL', 'SELL', stop=SL, alert_message='Sell SL hit')
table.cell(table_id=UpTabl, column=0, row=2, text='Sell')
table.cell(table_id=UpTabl, column=1, row=2, text=str.tostring(close))
table.cell(table_id=UpTabl, column=2, row=2, text=str.tostring(SL))
table.cell(table_id=UpTabl, column=3, row=2, text=str.tostring(TARGET1))
table.cell(table_id=UpTabl, column=4, row=2, text=str.tostring(TARGET2))
table.cell(table_id=UpTabl, column=5, row=2, text=str.tostring(TARGET3))
action := 'SELL'
table_bg_color := color.orange
table.set_bgcolor(table_id=UpTabl, bgcolor=table_bg_color)
// ===== EXIT CONDITIONS =====
if action == 'BUY' and barstate.isconfirmed and o2 > c2
strategy.close_all(comment='Long Exit', alert_message='Long Exit')
table.clear(UpTabl, 0, 2, 5, 2)
action := string('')
table_bg_color := color.gray
table.set_bgcolor(table_id=UpTabl, bgcolor=table_bg_color)
if action == 'SELL' and barstate.isconfirmed and o2 < c2
strategy.close_all(comment='Short Exit', alert_message='Sell Exit')
table.clear(UpTabl, 0, 2, 5, 2)
action := string('')
table_bg_color := color.gray
table.set_bgcolor(table_id=UpTabl, bgcolor=table_bg_color)
// ===== PLOT ENTRY SHAPES =====
plotshape(barstate.isconfirmed and longCondition ? close : na, title='B', text='BUY', location=location.belowbar, style=shape.labelup, size=size.tiny, color=color.new(color.green, 0), textcolor=color.new(color.white, 0))
plotshape(barstate.isconfirmed and shortCondition ? close : na, title='S', text='SHORT', location=location.abovebar, style=shape.labeldown, size=size.tiny, color=color.new(color.red, 0), textcolor=color.new(color.white, 0))