
🚀 O quão poderoso é este estratégia?
Sabia que? Esta estratégia é como colocar "olhos de fogo" nas suas negociações! Ela foi projetada especificamente para scalping de 1 minuto e 5 minutos, combinando os 5 indicadores técnicos mais poderosos: EMA rápida e lenta, RSI, MACD, Bandas de Bollinger e um filtro de volume. Simplificando, permite capturar com precisão todas as pequenas flutuações do mercado!
💡 Ponto chave! Como funciona este conjunto de golpes?
Imagine que esta estratégia é como um "entrevistador" super exigente: apenas oportunidades de negociação que satisfazem múltiplas condições simultaneamente passam pelo filtro:
Sinal de alta deve satisfazer: preço acima da EMA rápida, cruzamento de ouro do MACD e positivo, rompimento da banda superior de Bollinger, RSI entre 50-80, e volume suficiente para suportar. Isto é tão rigoroso quanto exigir que uma pessoa tenha boa aparência, talento e boa personalidade ao mesmo tempo!
Sinal de baixa é o oposto: todas as condições devem ser satisfeitas de forma inversa, garantindo que cada negociação tenha suporte técnico sólido.
⚡ Guia para evitar armadilhas: Por que escolher scalping?
A parte mais inteligente desta estratégia é o seu controlo de risco! Stop loss definido em 0,5%, take profit em 1,0%, com uma relação risco-retorno de 1:2. É como a perfeita interpretação de "apostas pequenas para se divertir" - cada perda é muito pequena, mas o lucro pode duplicar!
E tem um design atencioso: no gráfico de 1 minuto, desativa automaticamente o reconhecimento de padrões de candlestick, porque o ruído dos padrões de candlestick no scalping é muito grande e pode enganar a análise. Isto é tão inteligente quanto reduzir o ruído automaticamente num ambiente barulhento!
🎯 Aplicação prática: Que problemas esta estratégia pode resolver para si?
Público-alvo: Amigos que desejam fazer day trading no mercado de criptomoedas, especialmente aqueles que procuram acumular lucros através de negociações pequenas e frequentes.
Resolver problemas: Livrar-se dos falsos sinais de indicadores únicos! Através de um mecanismo de confirmação múltipla, a fiabilidade dos sinais é grandemente melhorada. Ao mesmo tempo, o controlo rigoroso de risco garante que, mesmo que erre o julgamento, as perdas ficam dentro de limites controláveis.
Lembre-se, esta estratégia é como um bisturi de precisão: funciona melhor em pares de criptomoedas com alta liquidez. Combinada com uma boa gestão de capital, pode tornar-se uma ferramenta poderosa no seu arsenal de negociação!
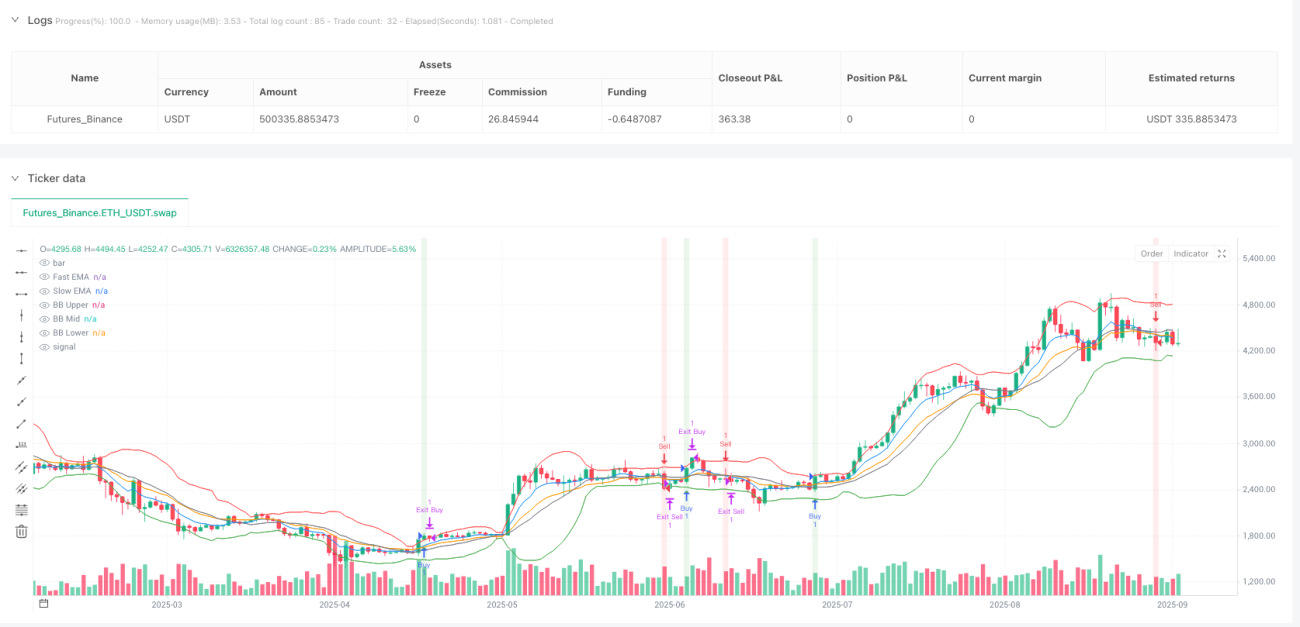
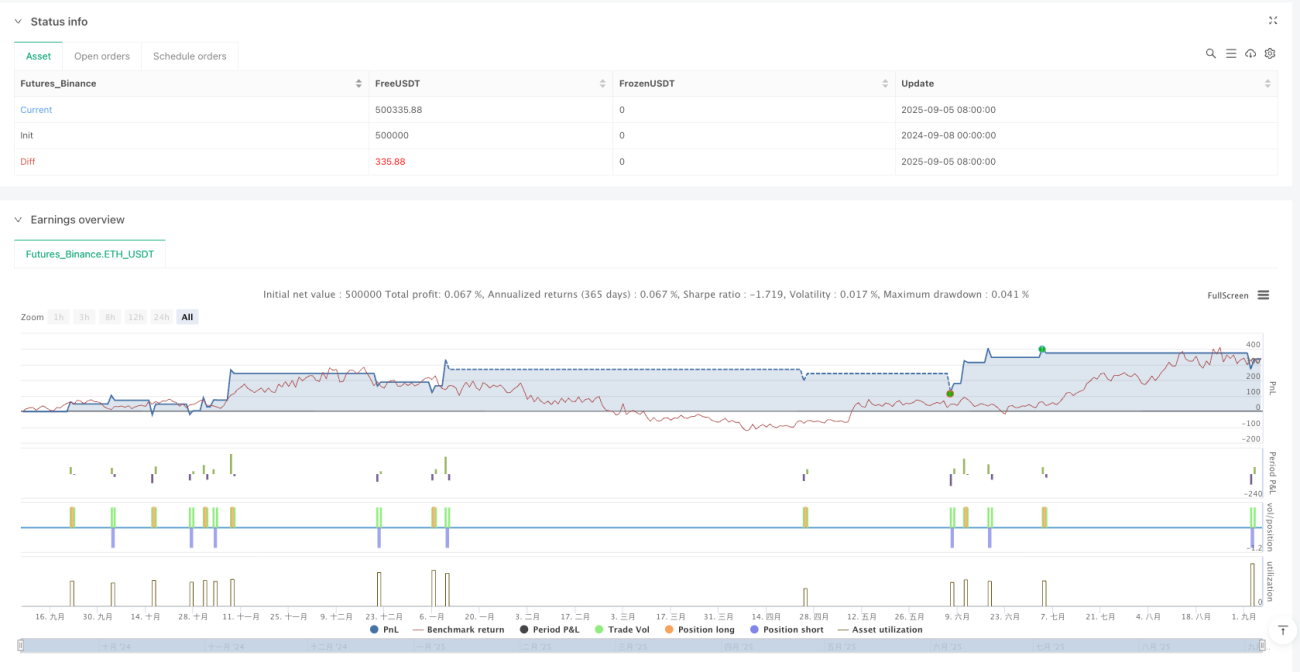
/*backtest
start: 2024-09-08 00:00:00
end: 2025-09-06 08:00:00
period: 1d
basePeriod: 1d
exchanges: [{"eid":"Futures_Binance","currency":"ETH_USDT","balance":500000}]
*/

//@version=5
strategy("Advanced Crypto Scalping Strategy - 1 & 5 Min Charts", overlay=true, margin_long=100, margin_short=100)

// Inputs for customization (optimized for 1-min and 5-min timeframes)- 1