Estratégia do Ciclo de Halving do Bitcoin

Estratégia do Ciclo de Halving: Dados Históricos Mostram Rentabilidade Média Superior a 1000%
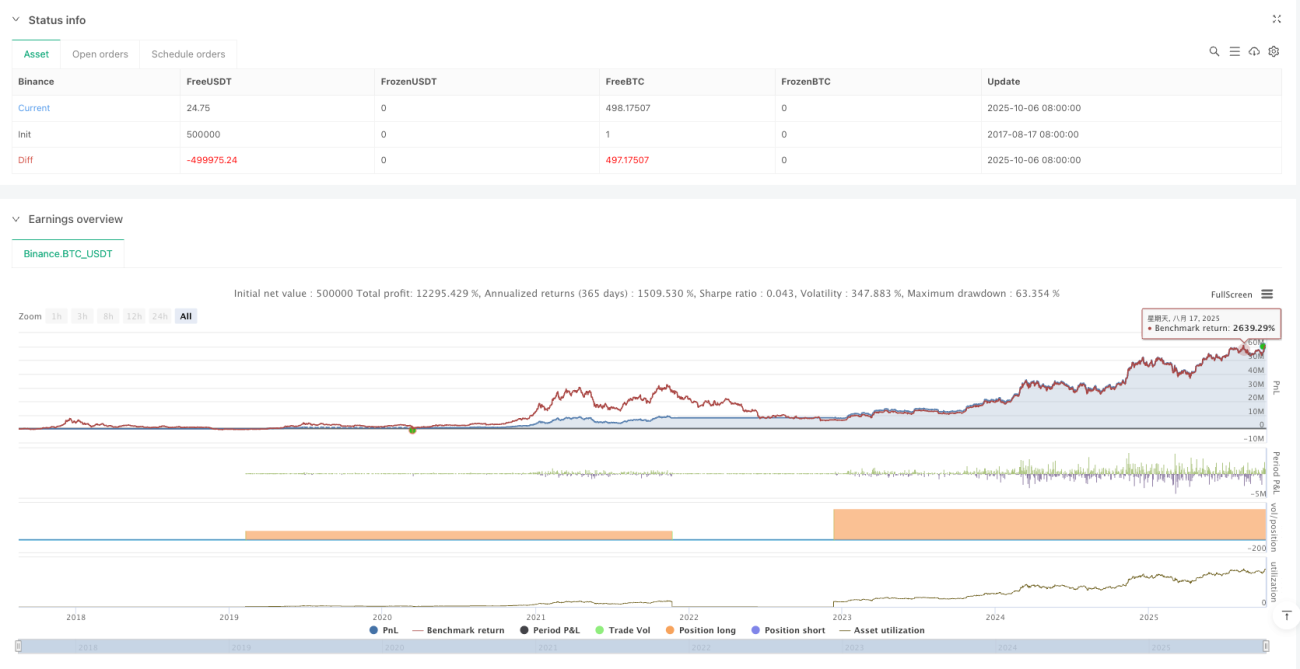
Esta não é apenas mais uma estratégia de análise técnica, mas sim um quadro de investimento de longo prazo baseado no ciclo de halving de 4 anos do Bitcoin. Os dados de backtest mostram que, seguindo rigorosamente os pontos de tempo do halving para comprar e vender, a rentabilidade máxima em um único ciclo pode ultrapassar 2000%. Mas não se empolgue: esta estratégia exige uma força de vontade e tolerância ao risco extremamente fortes.
A lógica central é simples e direta: comprar no halving, vender parcialmente para realizar lucros entre 40 e 80 semanas depois, e recompor a posição após 135 semanas. Parece fácil, mas exige uma força de vontade de aço para ser executada.
Quadro Operacional de Três Fases: Timing Mais Preciso que o DCA Tradicional
Fase Um: Período de Compra no Halving (0-40 semanas)
Inicie a posição imediatamente após o evento de halving; este é o ponto de entrada central de toda a estratégia. Dados históricos mostram que as primeiras 40 semanas após o halving são o melhor período de acumulação, pois o sentimento do mercado geralmente ainda não refletiu totalmente o impacto da redução da oferta.
Fase Dois: Período de Realização de Lucros (40-80 semanas)
As 40-80 semanas após o halving são historicamente a janela de ouro para a explosão do preço do Bitcoin. Após o halving de 2016, o Bitcoin valorizou mais de 3000% em 78 semanas, e situação similar ocorreu após o halving de 2020. Esta janela de tempo não é um palpite, mas uma derivação matemática baseada nos fundamentos de oferta e demanda.
Fase Três: Período de Recomposição em Baixa (após 135 semanas)
Cerca de 135 semanas após o halving, o mercado geralmente entra em um bear market profundo. Neste momento, inicia-se a estratégia DCA. Esta escolha de timing é superior ao DCA cego, pois evita investimentos ineficazes nos picos do mercado altista.
Controle de Risco: Não é uma Estratégia Infalível, Exige Disciplina Rigorosa
Maior Risco: Falta de Capacidade de Execução
O maior inimigo da estratégia não é a volatilidade do mercado, mas a natureza humana. Comprar no halving requer agir de forma contrária ao mercado em momentos de pessimismo, e realizar lucros requer manter a calma em meio à euforia. A história mostra que 90% das pessoas não conseguem executar a estratégia completamente.
Requisitos de Gestão de Capital
Recomenda-se não investir mais de 20% do patrimônio total em uma única vez, pois um único ciclo pode enfrentar um drawdown superior a 80%. No bear market de 2018, o Bitcoin caiu de US\( 20.000 para US\) 3.200, e mesmo comprando no momento "correto", o investidor teria que suportar uma enorme perda não realizada.
Risco de Mudança nas Condições de Mercado
A estratégia baseia-se em dados de 3 ciclos completos, mas o mercado de Bitcoin está amadurecendo. A entrada de capital institucional, a aprovação de ETFs e outros fatores podem alterar as regras tradicionais do ciclo. Desempenho passado não garante resultados futuros; esta não é uma frase vazia.
Configuração de Parâmetros: Baseada em Modelos Matemáticos, Não em Julgamento Subjetivo
Início da Realização de Lucros às 40 Semanas: Com base no ponto de equilíbrio entre oferta e demanda após halvings históricos. Realizar lucros cedo demais pode fazer o investidor perder o movimento principal de alta; tarde demais pode resultar em vendas no topo.
Fim da Realização de Lucros às 80 Semanas: Dados históricos mostram que 80 semanas após o halving é um intervalo de alta probabilidade para o preço atingir o pico. Neste momento, é necessário começar a reduzir a posição gradualmente, sem cobiçar o último trecho de alta.
Início do DCA às 135 Semanas: A solução estatisticamente ótima para a região de fundo do bear market. Iniciar o DCA neste momento oferece a melhor relação risco-retorno.
Conselhos Práticos: Adequado para Investidores de Longo Prazo, Não para Traders de Curto Prazo
Esta estratégia é adequada para capital com horizonte de investimento superior a 5 anos. Não é recomendada para investidores que precisam do dinheiro rapidamente ou que têm baixa tolerância ao risco. Um único ciclo pode exigir suportar um período de prejuízo não realizado de 2 a 3 anos, o que gera uma pressão psicológica imensa.
A taxa de sucesso da estratégia não reside em prever o preço de curto prazo, mas sim em aproveitar o ciclo de oferta e demanda de longo prazo. O halving do Bitcoin é um evento certo, mas o timing e a magnitude da reação do preço ainda apresentam incertezas.
Aviso Importante: Esta é uma estratégia de investimento de alto risco, com a possibilidade de perda total do capital investido. Dados de backtest histórico não garantem retornos futuros. Avalie cuidadosamente sua própria tolerância ao risco antes de investir.
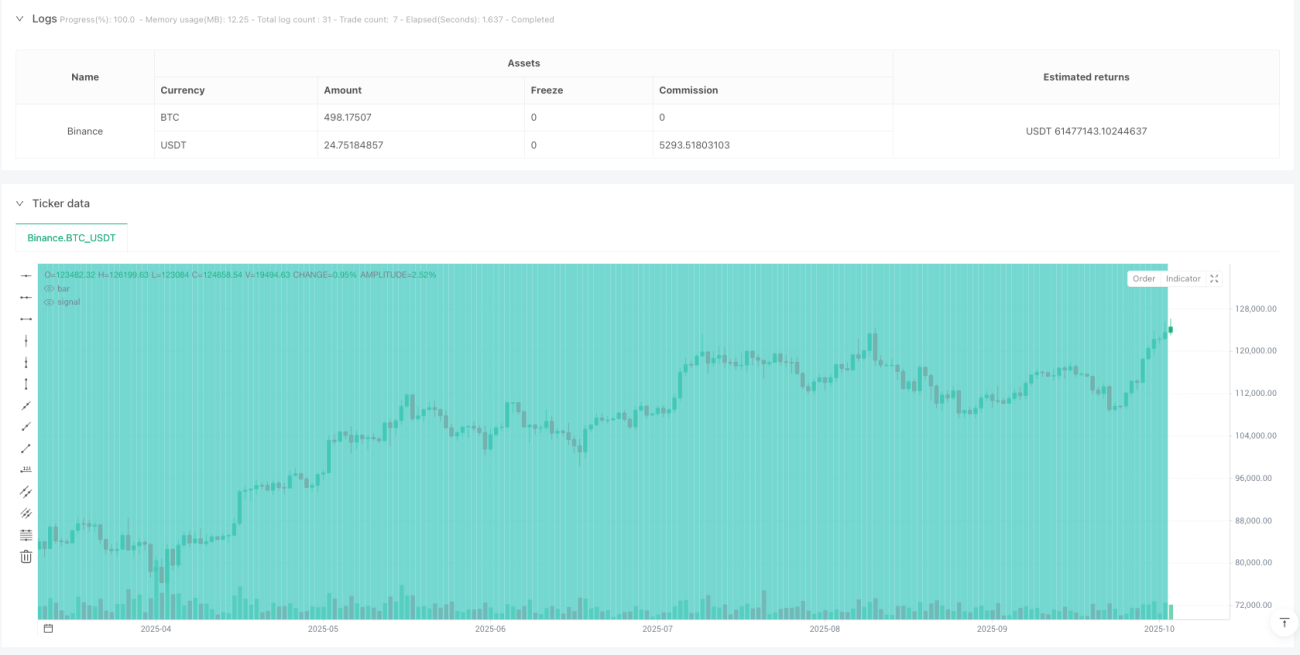
/*backtest
start: 2017-08-17 08:00:00
end: 2025-10-07 08:00:00
period: 1d
basePeriod: 1d
exchanges: [{"eid":"Binance","currency":"BTC_USDT","balance":500000}]
*/

//@version=6
strategy(title='Bitcoin Halving Cycle Profit - Backtesting', shorttitle='BTC Halv', overlay=true, default_qty_type=strategy.percent_of_equity, default_qty_value=100, initial_capital=10000, commission_type=strategy.commission.percent, commission_value=0.1)

// ════════════════════════════════════════════════════════════════════════════════════════════════- 1