
Esta estratégia é como fazer um mapa de barras dançar no balanço! Transforma um mapa de K comum em um Heiken Ashi mais liso, e, em seguida, combina-o com uma linha de referência de um mapa de nuvens de Ichimoku, o que é o “patinaxe de dois em dois” no mundo da análise técnica.
A essência da estratégia está no “sistema de triplo filtro”, tão rigoroso quanto você escolhe o objeto do cardiômetro! Primeiro, o Heiken Ashi deve estar do lado certo da linha de referência do Ichimoku (que é o limiar básico); em seguida, o 200 ciclo EMA garante que você siga a grande tendência (não vá contra a corrente); e, finalmente, o Ichimoku fica atrás do filtro para garantir que a direção do momento seja correta (para evitar falsos buracos de ruptura).
Isso é como dirigir: o sinal verde é aceso (sinal HA), a estrada está em bom estado (filtragem de tendência) e não há veículos em marcha atrás à frente (confirmação de desvio).
A parte mais inteligente desta estratégia é usar o ATR (Average True Range) para definir o stop loss. Ele se ajusta automaticamente à volatilidade do mercado, como o sistema de navegação adaptativo de um carro.
O que é ainda melhor, é que ele usa vários tempos: ATR em tempos altos para parar o quebra-cabeça (deixar os lucros correrem), ATR em tempos baixos para parar o quebra-cabeça (proteger os fundos).
Esta estratégia é especialmente adequada para ambientes de mercado com tendências evidentes. Quando o mercado está em um movimento horizontal, é recomendado esperar por algum tempo, pois o Heiken Ashi é propenso a produzir falsos sinais em mercados de turbulência. O melhor cenário de uso é: gráficos de 4 horas ou periódicos dos principais pares de moedas, especialmente na fase de confirmação de tendências após a publicação de dados econômicos importantes.
Lembre-se de que nenhuma estratégia é universal! A força desta estratégia é capturar tendências de médio e longo prazo, e se você é um trader de linhas curtas que gosta de entrar e sair rapidamente, talvez seja necessário ajustar os parâmetros ou procurar outras estratégias.
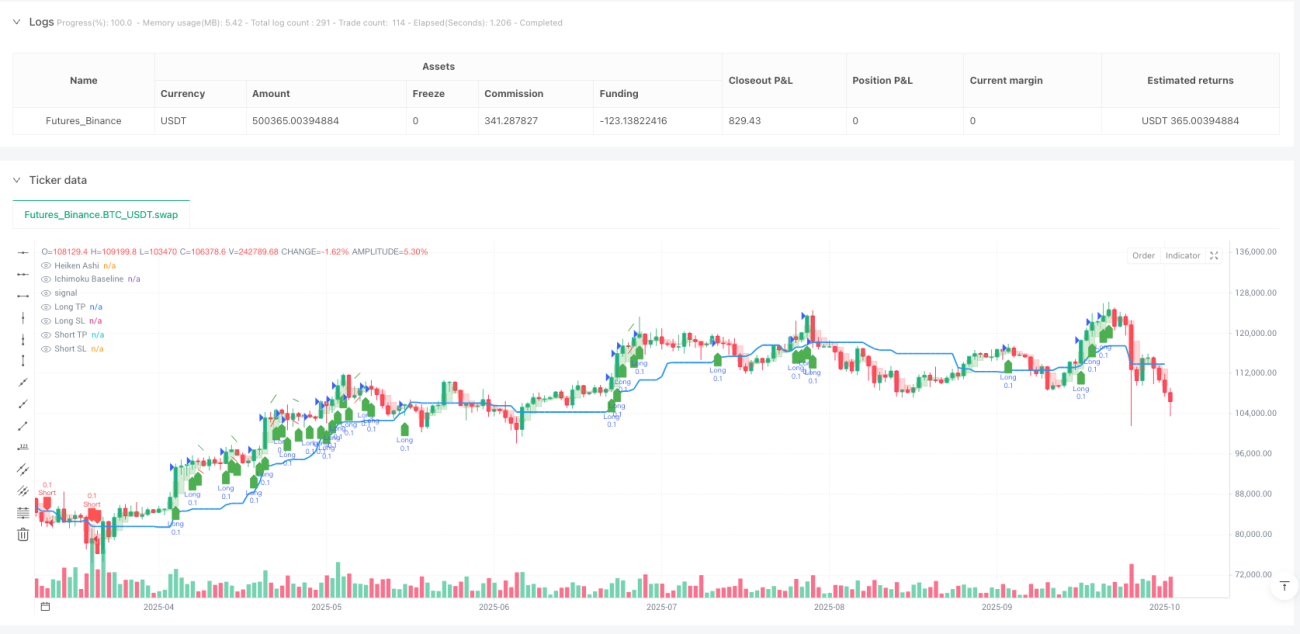
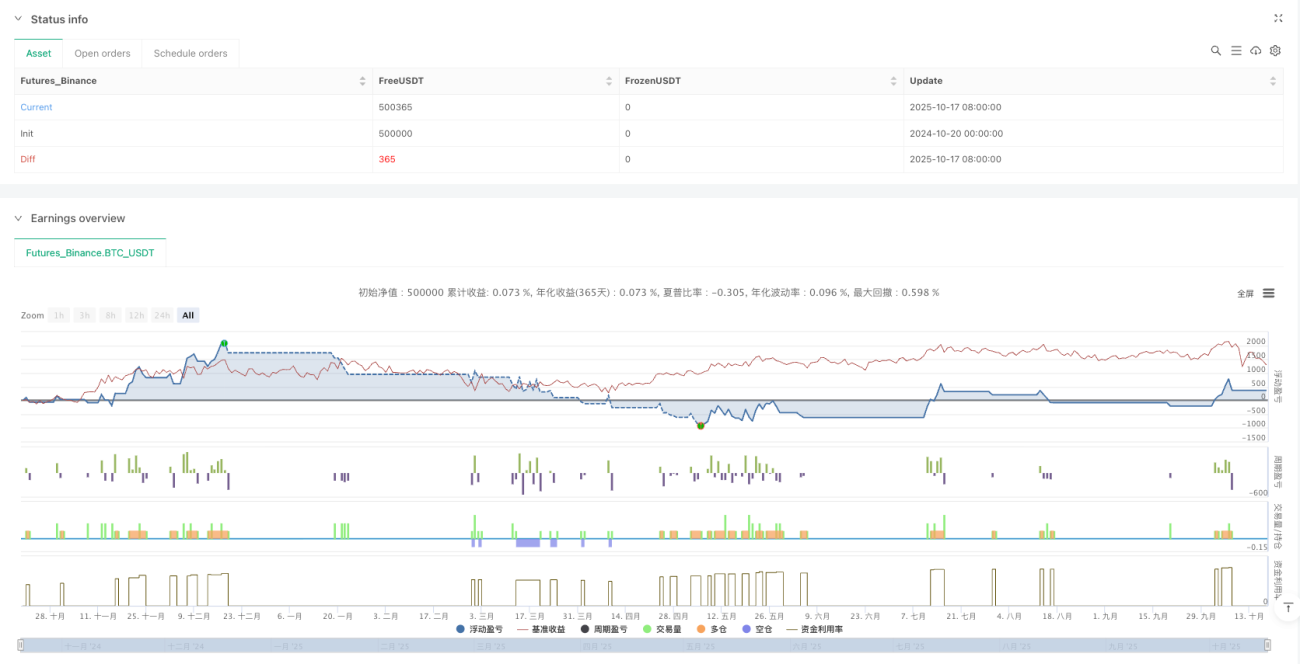
/*backtest
start: 2024-10-20 00:00:00
end: 2025-10-18 08:00:00
period: 1d
basePeriod: 1d
exchanges: [{"eid":"Futures_Binance","currency":"BTC_USDT","balance":500000}]
*/
// This Pine Script® code is subject to the terms of the Mozilla Public License 2.0 at https://mozilla.org/MPL/2.0/
// © MahdiSalari8
//@version=6
strategy("Heiken Ashi Bas", overlay=true,
default_qty_type=strategy.fixed,
default_qty_value=0.1,
commission_type=strategy.commission.percent,
commission_value=0.07,
initial_capital=10000000,
pyramiding=0) // Changed to 0
// Inputs
useTrendFilter = input.bool(true, "Use 200 EMA Trend Filter", group="Filters")
showSignals = input.bool(true, "Show Buy/Sell Signals", group="Visuals")
showEma = input.bool(false, "Show 200 EMA", group="Visuals")
atrPeriod = input.int(14, "ATR Period", minval=1, group="Risk Management")
htf = input.timeframe("5", "Higher Timeframe for TP", group="Timeframes")
ltf = input.timeframe("1", "Lower Timeframe for SL", group="Timeframes")
tpMultiplier = input.float(2.0, "TP Multiplier", minval=0.1, group="Risk Management")
slMultiplier = input.float(1.0, "SL Multiplier", minval=0.1, group="Risk Management")
// Ichimoku Divergence Settings
useDivergenceFilter = input.bool(true, "Use Ichimoku Divergence Filter", group="Ichimoku Divergence")
showDivergenceLine = input.bool(true, "Show Divergence Line", group="Ichimoku Divergence")
divergenceLookback = input.int(2, "Divergence Lookback (bars)", minval=1, maxval=20, group="Ichimoku Divergence")
divergenceLineWidth = input.int(5, "Divergence Line Width", minval=1, maxval=5, group="Ichimoku Divergence")
// Heiken Ashi Calculation
var float haOpen = na
var float haClose = na
var float haHigh = na
var float haLow = na
haClose := (open + high + low + close) / 4
haOpen := na(haOpen[1]) ? (open + close) / 2 : (haOpen[1] + haClose[1]) / 2
haHigh := math.max(high, math.max(haOpen, haClose))
haLow := math.min(low, math.min(haOpen, haClose))
// Ichimoku Baseline (Kijun-sen)
kijunPeriod = 26
kijunSen = (ta.highest(high, kijunPeriod) + ta.lowest(low, kijunPeriod)) / 2
// Ichimoku Baseline Divergence Calculation
currentBaseline = kijunSen
pastBaseline = kijunSen[divergenceLookback]
// Calculate slope (divergence)
baselineSlope = (currentBaseline - pastBaseline) / divergenceLookback
// Determine bullish/bearish divergence (exclude when slope is 0)
bullishDivergence = baselineSlope > 0
bearishDivergence = baselineSlope < 0
slopeIsZero = baselineSlope == 0
// Trend Filter (200 EMA)
ema200 = ta.ema(close, 200)
// ATR Calculation for different timeframes
htfAtr = request.security(syminfo.tickerid, htf, ta.atr(atrPeriod))
ltfAtr = request.security(syminfo.tickerid, ltf, ta.atr(atrPeriod))
// Enhanced Entry Conditions with Divergence Filter (exclude when slope is 0)
longCondition = haClose > kijunSen and
haClose[1] >= kijunSen[1] and
haClose > haOpen and
(haHigh - haClose) >= (haClose - haOpen) * 0.3 and
(not useTrendFilter or close > ema200) and
(not useDivergenceFilter or (bullishDivergence and not slopeIsZero))
shortCondition = haClose < kijunSen and
haClose[1] <= kijunSen[1] and
haClose < haOpen and
(haClose - haLow) >= (haOpen - haClose) * 0.3 and
(not useTrendFilter or close < ema200) and
(not useDivergenceFilter or (bearishDivergence and not slopeIsZero))
// Dynamic TP/SL based on ATR
longTp = close + (htfAtr * tpMultiplier)
longSl = close - (ltfAtr * slMultiplier)
shortTp = close - (htfAtr * tpMultiplier)
shortSl = close + (ltfAtr * slMultiplier)
// Strategy Execution
if (longCondition)
strategy.entry("Long", strategy.long)
strategy.exit("Long Exit", "Long", limit=longTp, stop=longSl)
if (shortCondition)
strategy.entry("Short", strategy.short)
strategy.exit("Short Exit", "Short", limit=shortTp, stop=shortSl)
// Plotting
plot(kijunSen, color=color.blue, title="Ichimoku Baseline", linewidth=2, display=display.all)
// Plot Divergence Line (gray when slope is 0)
plot(showEma ? ema200 : na, color=color.purple, title="200 EMA", linewidth=1, display=display.all)
// Heiken Ashi Candles with 25% opacity
candleColor = haClose > haOpen ? color.new(color.green, 75) : color.new(color.red, 75)
plotcandle(haOpen, haHigh, haLow, haClose, title="Heiken Ashi", color=candleColor, wickcolor=candleColor, bordercolor=candleColor, display=display.all)
// Plot Buy/Sell Signals with labelup/labeldown shapes
plotshape(showSignals and longCondition, style=shape.labelup, location=location.belowbar, color=color.new(color.green, 0), size=size.small, title="Buy Signal", display=display.all)
plotshape(showSignals and shortCondition, style=shape.labeldown, location=location.abovebar, color=color.new(color.red, 0), size=size.small, title="Sell Signal", display=display.all)
// Plot TP/SL levels - TP as lines with breaks, SL hidden by default
plot(strategy.position_size > 0 ? longTp : na, "Long TP", color=color.green, style=plot.style_linebr, linewidth=1, display=display.all)
plot(strategy.position_size > 0 ? longSl : na, "Long SL", color=color.red, style=plot.style_linebr, linewidth=1, display=display.none)
plot(strategy.position_size < 0 ? shortTp : na, "Short TP", color=color.green, style=plot.style_linebr, linewidth=1, display=display.all)
plot(strategy.position_size < 0 ? shortSl : na, "Short SL", color=color.red, style=plot.style_linebr, linewidth=1, display=display.none)
// Alerts
alertcondition(longCondition, "Long Signal", "HA Cross Above Kijun-sen with Bullish Divergence")
alertcondition(shortCondition, "Short Signal", "HA Cross Below Kijun-sen with Bearish Divergence")