Robô de Investimento Programado Inteligente

🤖 Isto não é um DCA comum — é um robô de DCA que pensa!
Sabia que? A maioria das pessoas faz DCA comprando cegamente, mas esta estratégia é como ter um assistente de investimento super inteligente! Ela ajusta o valor de cada compra com base nas condições do mercado, começando com 5% e aumentando gradualmente até 100%. É como ir à feira: comprar mais quando está barato e menos quando está caro. Simples, direto e extremamente eficaz!
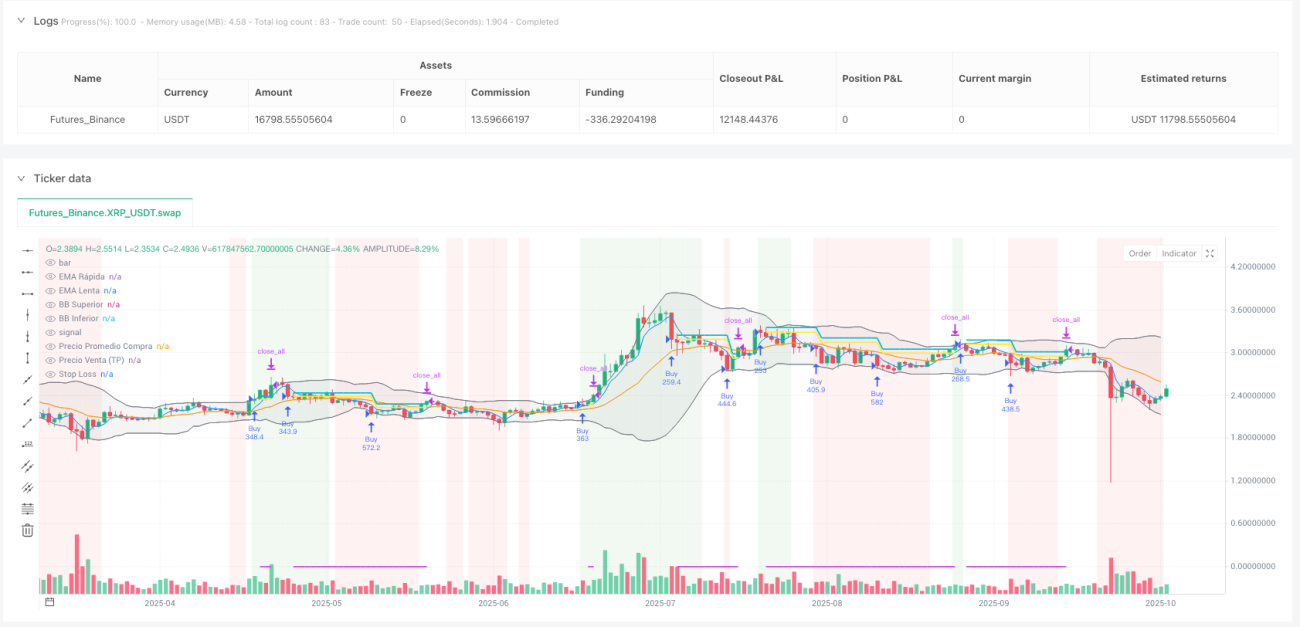
📊 Quatro indicadores técnicos combinados, tendência de mercado clara de uma só vez
Atenção! Esta estratégia usa uma combinação de quatro indicadores técnicos:
- Médias Móveis Exponenciais rápida/lenta: como um "eletrocardiograma" do mercado, mostram a direção da tendência
- MACD: o "barômetro" do momentum do mercado, para avaliar momentos de compra e venda
- RSI: o "termômetro" de sobrecompra/sobrevenda, para evitar comprar nas tops e vender nos fundos
- Bandas de Bollinger: a "zona de segurança" da volatilidade dos preços, para suporte e resistência
Esses quatro indicadores trabalham juntos como se fossem os "Vingadores" — cada um tem sua função, mas atuam em perfeita sintonia!
💡 Lógica inteligente de acumulação: comprar mais conforme a queda
Guia para evitar armadilhas! O maior problema do DCA comum é não controlar o tamanho da posição. Esta estratégia é muito mais esperta:
- A primeira compra usa 5% do capital para testar o mercado
- Cada compra adicional aumenta o investimento em 2,5%
- Quanto mais o preço cai, maior o espaçamento entre as compras (2%, 6%, 10%...)
- O investimento máximo por vez nunca excede 100% do capital total
É como subir de nível em um jogo — o investimento aumenta conforme se avança, mas o risco é mantido sob controle!
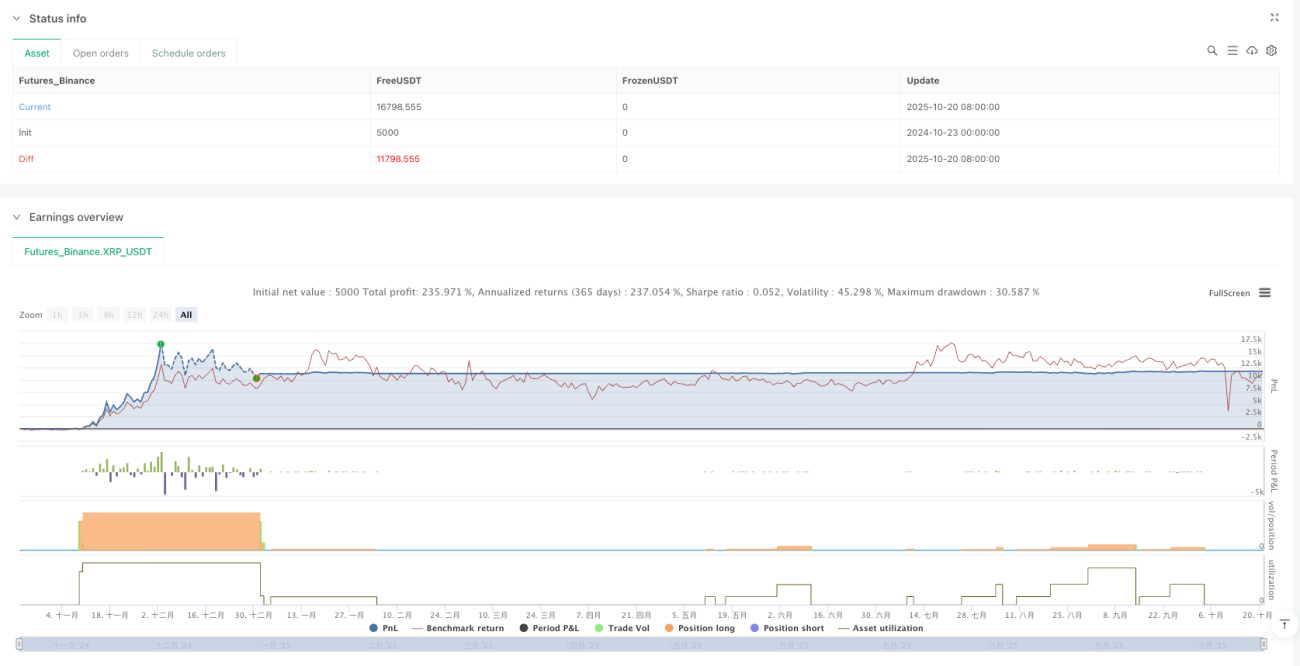
🎯 Take-profit e stop-loss inteligentes: deixe os lucros correrem e as perdas pararem
A lógica de venda desta estratégia é super amigável:
- Mínimo de 2% de lucro para considerar a venda: não seja um "otário que trabalha duro por nada"
- Saia quando a tendência enfraquecer: colha os lucros enquanto pode, guarde-os no bolso
- Queda de 2% no preço dispara sinal de venda: proteja os lucros de voltarem
- Stop-loss configurável: embora o padrão seja 100% (praticamente nunca acionado), você pode ajustar conforme sua tolerância ao risco
Resumindo, esta estratégia é "implacável quando está ganhando dinheiro, e decisiva na hora de correr"!
// This Pine Script™ code is subject to the terms of the MPL 2.0 at https://mozilla.org/MPL/2.0/
// © MTB by Neurodoc
// By Nicolás Astorga

//@version=5
strategy("Master Trading Bot by Neurodoc",
         shorttitle="MTB Adaptation",
         overlay=true,
         initial_capital=10000,
         pyramiding=100,
         commission_value=0.1,
commission_type=strategy.commission.percent,- 1