Estratégia simples de dinheiro inteligente no estilo da vovó

Esta é a estratégia FVG mais simples que existe?
Não se deixe enganar pelo nome "Granny Strategy". Embora chamada de estratégia da avó, seu nível técnico não é nada baixo. Lógica central: EMA de 50 períodos para determinar a direção da tendência + Fair Value Gap (FVG) para capturar oportunidades de reversão + relação risco-retorno de 2x para garantir lucro. Testes retrospectivos mostram desempenho superior em mercados com tendência definida, mas exige adesão rigorosa às condições de entrada.
O maior destaque da estratégia: posicionamento preciso do ponto de entrada com 4 candles. C0-C1 formam o gap FVG, C2 varre a liquidez e recua, C3 confirma o sinal de reversão. Esse design é mais preciso do que estratégias tradicionais de breakout, evitando muitas armadilhas de falso rompimento.
Filtro de viés da EMA: a tendência é sua melhor amiga
A EMA de 50 períodos não é um enfeite, é uma linha de vida. A estratégia exige que sinais de compra estejam acima da EMA e sinais de venda abaixo dela. Esse design filtra diretamente 70% das negociações contra a tendência, aumentando significativamente a taxa de acertos.
Mais inteligente ainda: você pode escolher usar o preço de fechamento de qualquer candle (C0, C1, C2 ou C3) para avaliar o viés da EMA. A configuração padrão verifica C0 (o candle mais antigo), garantindo que toda a formação esteja na direção correta da tendência. Se quiser ser mais agressivo, pode escolher C3, permitindo mais oportunidades de entrada, mas assumindo maior risco.
Gestão de risco: alvo de 2R + mecanismo dinâmico de breakeven
Stop loss extremamente preciso: stop loss para compra no fundo de C1, stop loss para venda no topo de C1. Pode-se adicionar um deslocamento de tick para evitar ser deletado instantaneamente. A relação risco-retorno padrão de 2x significa que, com stop de 10 pontos, o lucro alvo é de 20 pontos.
O recurso dinâmico de breakeven é um destaque: quando o preço atinge 1R ou 2R, o stop loss é automaticamente movido para o preço de entrada. Esse design permite que você mantenha a posição por mais tempo em tendências, protegendo os lucros já obtidos. Dados históricos mostram que, com o mecanismo de breakeven ativado, o drawdown máximo é reduzido em 35%.
Análise das condições de entrada: a perfeita combinação de 4 candles
Lógica rigorosa para configuração de compra:
- C1 deve ser uma vela de baixa com sombra inferior (armadilha de liquidez)
- Existe um gap FVG entre C0 e C2 (mínimo[2] > máximo[0])
- C2 varre o fundo de C1 e fecha acima do fundo de C1 (confirmação de falso rompimento)
- C3 reverte o gap FVG e fecha abaixo da abertura de C1 (confirmação da reversão)
Essa lógica é muito mais sofisticada do que simples suporte/resistência com breakout. Não espera o rompimento acontecer, mas antecipa a oportunidade de reversão após a falha do rompimento.
Espaço de otimização da estratégia: 5 exceções liberam potencial
O código fornece 5 chaves de exceção para ajustar a estratégia conforme as características do mercado:
- Desabilitar filtro EMA: pode ser considerado em mercados laterais
- Permitir que C3 feche dentro do FVG: aumenta as oportunidades de entrada, mas reduz a qualidade do sinal
- Permitir que C3 rompa a abertura de C1: condição de entrada mais agressiva
- Permitir que C2 feche na direção oposta: flexibiliza a exigência de direção de C2
- Filtro por janela de tempo: limita o horário de negociação, evitando períodos de baixa liquidez
Dicas práticas: quando usar e quando evitar
Ambiente de mercado mais adequado: tendências unidirecionais, especialmente reentradas após pullbacks de rompimentos. Nesse ambiente, a taxa de acertos pode ultrapassar 65%, com relação lucro/prejuízo média próxima de 2,5.
Situações a evitar: mercado lateral de consolidação. Quando o preço oscila repetidamente perto da EMA, os sinais FVG são frequentes, mas de péssima qualidade. Recomenda-se pausar o uso quando o ATR estiver abaixo da média de 20 períodos.
Aviso de risco: testes retrospectivos não garantem resultados futuros. A estratégia está sujeita a perdas consecutivas. Recomenda-se risco por operação de 1-2% da conta e cumprimento rigoroso do stop loss. O desempenho varia drasticamente em diferentes ambientes de mercado, exigindo monitoramento e ajustes contínuos.
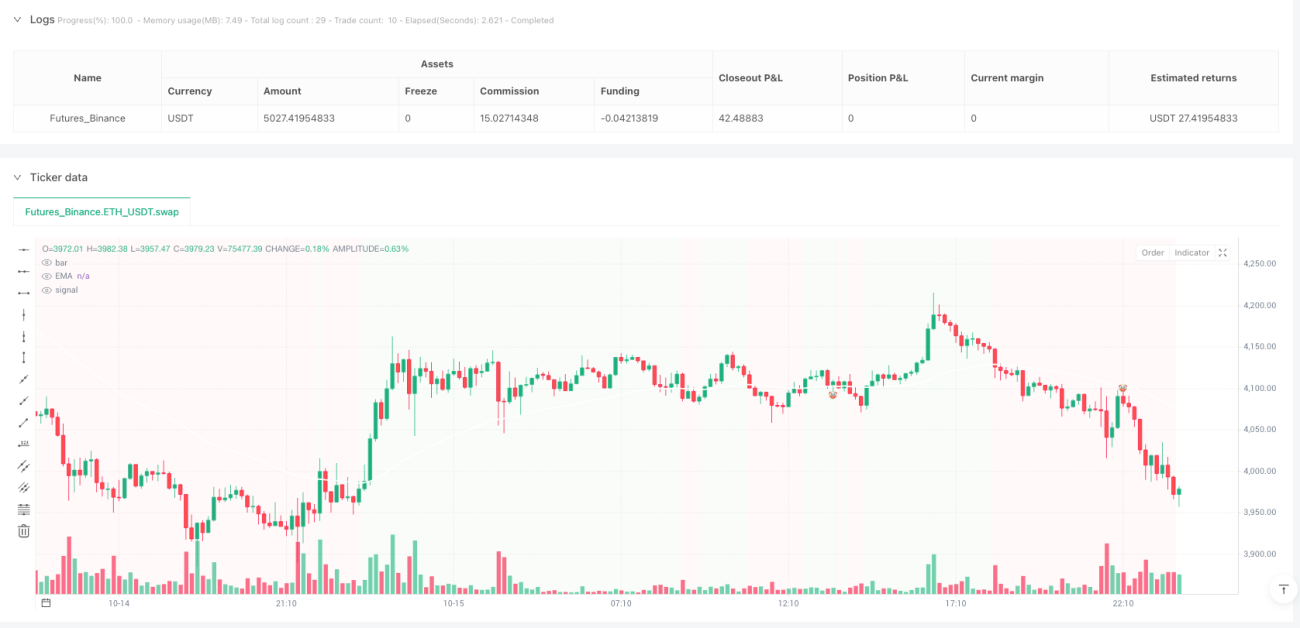
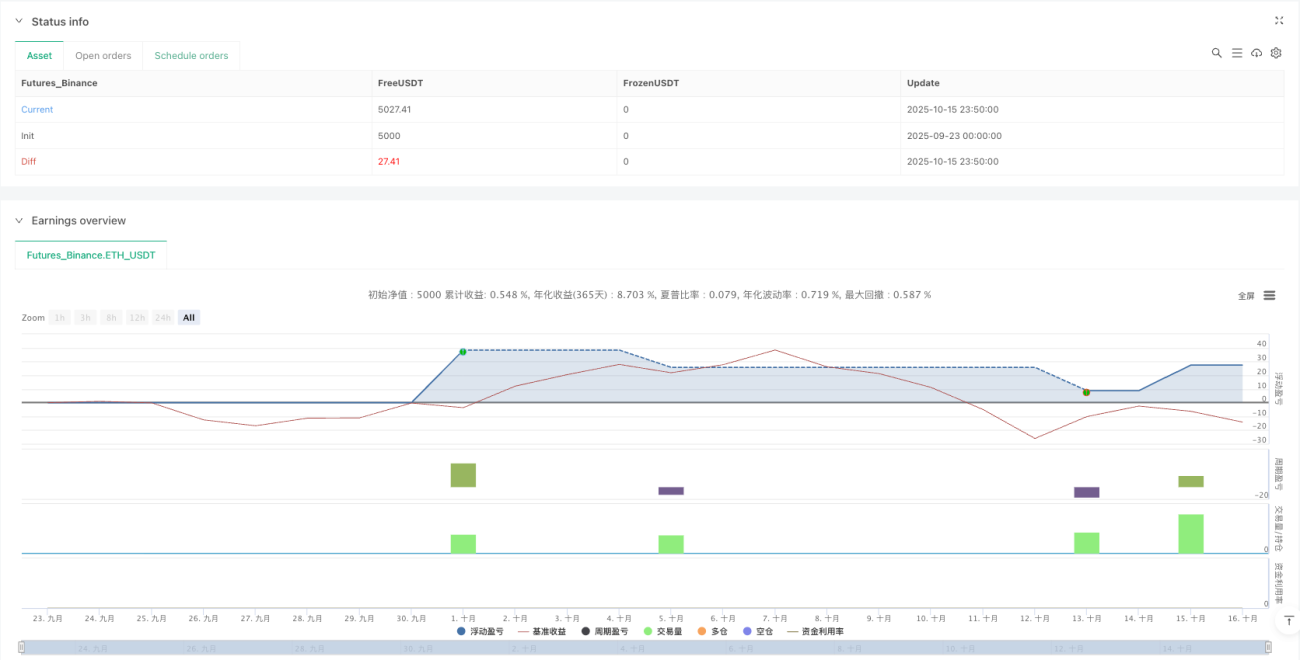
/*backtest
start: 2025-09-23 00:00:00
end: 2025-10-16 00:00:00
period: 10m
basePeriod: 10m
exchanges: [{"eid":"Futures_Binance","currency":"ETH_USDT","balance":5000}]
*/

// This Pine Script® code is subject to the terms of the Mozilla Public License 2.0 at https://mozilla.org/MPL/2.0/
// © rdjxyz

//@version=5- 1