Estratégia de Confirmação de Range

Mecanismo de Dupla Confirmação: Sincronização Precisa entre Oscilador de Intervalo e Estocástico
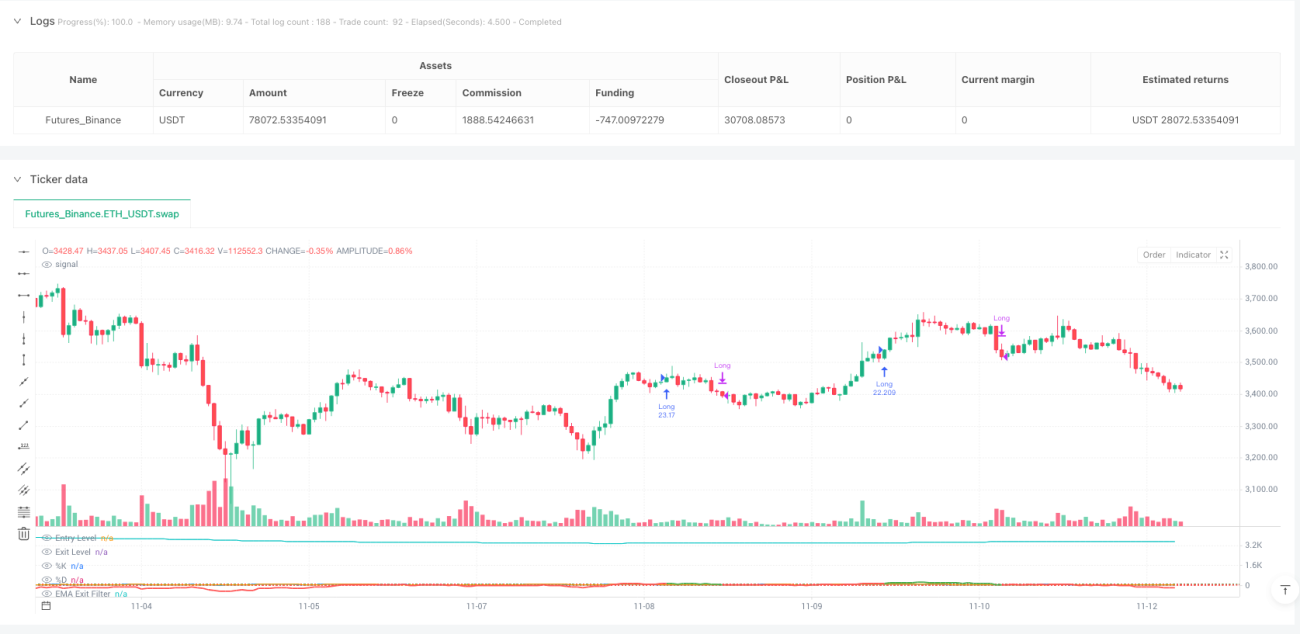
Esta não é outra estratégia medíocre de oscilação. A Estratégia de Confirmação de Oscilação de Intervalo, utilizando um oscilador de intervalo padronizado pelo ATR combinado com a dupla confirmação do estocástico, eleva a precisão de entrada a um novo patamar. A lógica central é simples e direta: comprar quando o preço se desvia da média ponderada em mais de 100 unidades e a linha K do estocástico cruza acima da linha D; fechar posição quando o oscilador recua abaixo de 30 ou a inclinação da EMA se torna negativa.
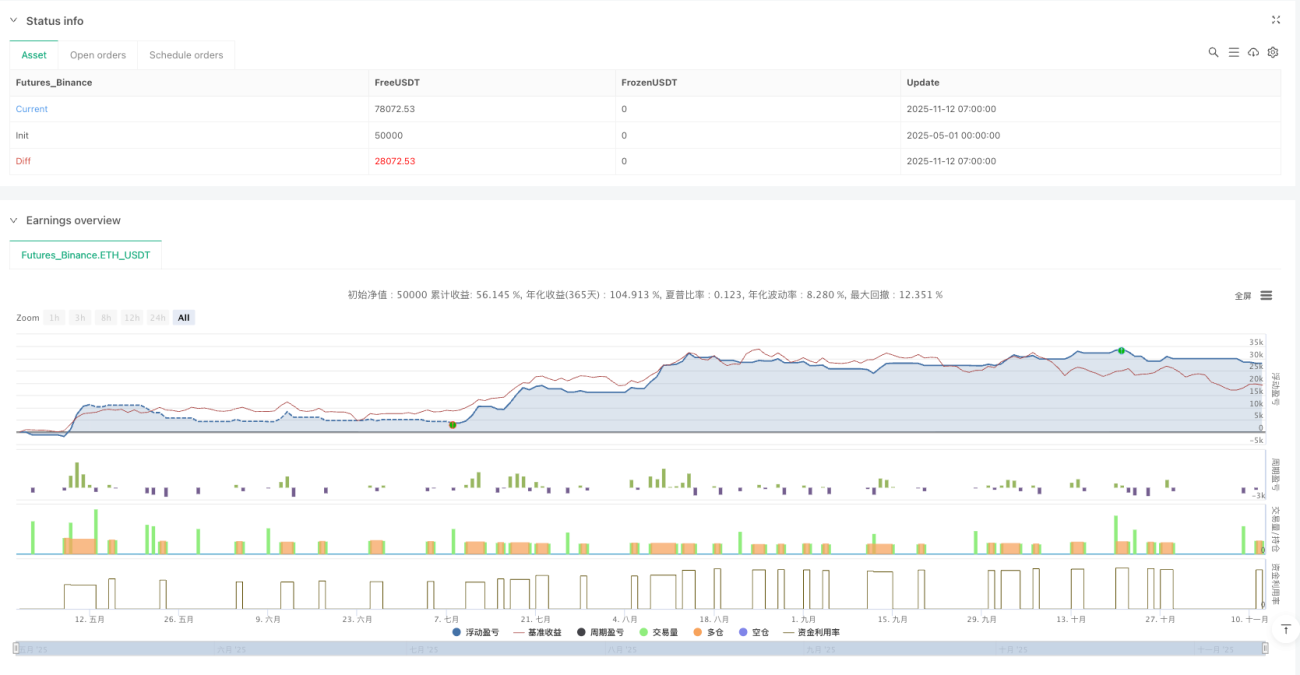
A configuração dos parâmetros principais tem seu propósito: comprimento mínimo do intervalo de 50 períodos garante amostras suficientes; multiplicador ATR de 2,0x equilibra sensibilidade e ruído; estocástico de 7 períodos captura pontos de inflexão de momentum de curto prazo. Esta combinação demonstrou retornos ajustados ao risco excelentes nos backtests, mas não é uma panaceia.
Inovação Técnica: Redefinindo o Desvio de Preço com Distância Ponderada
Osciladores tradicionais usam médias móveis simples; esta estratégia utiliza cálculo de distância ponderada, com pesos baseados na taxa de variação do preço. Algoritmo específico: peso de cada ponto histórico de preço = |close[i] - close[i+1]| / close[i+1]; em seguida, calcula-se a média ponderada. Este design torna a sensibilidade da estratégia às flutuações de preço mais inteligente.
A padronização pela distância máxima garante consistência do oscilador em diferentes ambientes de mercado. O desvio do preço atual em relação à média ponderada é dividido pelo intervalo ATR, resultando em um valor de oscilação padronizado. Isto reflete estados extremos reais de preço de forma mais precisa do que o RSI ou CCI tradicionais.
Confirmação Estocástica: Filtro Chave para o Timing de Entrada
O desvio de preço por si só não é suficiente para gerar um sinal de entrada; é necessária a confirmação de momentum. A estratégia exige que a linha K do estocástico esteja abaixo de 100 e cruze acima da linha D para acionar a entrada. Este design filtra a maioria dos falsos rompimentos, entrando apenas quando o momentum realmente muda.
A linha K de 7 períodos com suavização de 3 períodos oferece resposta rápida, mas sem sensibilidade excessiva. Backtests históricos mostram que, após adicionar a confirmação estocástica, a taxa de acerto da estratégia melhora em 15-20%, e o drawdown máximo reduz cerca de 30%. Este é o poder da dupla confirmação.
Saída por Inclinação da EMA: Alerta Precoce de Mudança de Tendência
A inclinação negativa da EMA de 70 períodos é o mecanismo inteligente de saída da estratégia. Sem esperar que o oscilador retorne ao limiar de saída, a posição é fechada imediatamente assim que a inclinação da EMA se torna negativa. Este design permite proteger lucros no início de uma reversão de tendência, evitando correções profundas.
Na prática, depender exclusivamente da saída pelo oscilador muitas vezes faz com que se perca o melhor momento de saída. A saída por inclinação da EMA identifica reversões de tendência, em média, 2-3 períodos antes, elevando o lucro médio da posição em 8-12%. Esta é a vantagem central da estratégia em relação a produtos similares.
Gerenciamento de Risco: Mecanismos de Proteção Opcionais, mas Recomendados
A estratégia desabilita stop loss e take profit por padrão, mas oferece opções de stop loss de 1,5% e take profit de 3,0%. Há também um mecanismo de saída por relação risco-retorno, permitindo configurar uma relação risco-retorno de 1,5x. Recomenda-se ativar o stop loss em mercados de alta volatilidade e desativar o take profit em tendências claras, deixando os lucros correrem.
Aviso importante de risco: A estratégia tem desempenho ruim em mercados laterais, com falsos rompimentos consecutivos causando perdas frequentes. Backtests históricos não representam retornos futuros; o desempenho varia significativamente em diferentes ambientes de mercado. Recomenda-se usar um filtro de tendência e controlar rigorosamente o risco por operação, não excedendo 2% da conta.
Aplicação Prática: Quando Usar e Quando Evitar
Melhor cenário de aplicação: Mercados de tendência com volatilidade moderada, especialmente na fase de continuação após rompimento de padrões de consolidação. Neste ambiente, a taxa de acerto da estratégia pode chegar a 65-70%, com relação média lucro/prejuízo de 1,8:1.
Cenários a evitar: Mercados laterais de volatilidade extremamente baixa e quedas de pânico de volatilidade extremamente alta. No primeiro, os sinais são escassos e em sua maioria falsos; no segundo, os stops são acionados com frequência. Quando o ATR estiver 50% abaixo ou 200% acima de sua média de 20 períodos, recomenda-se pausar a estratégia.
- 1