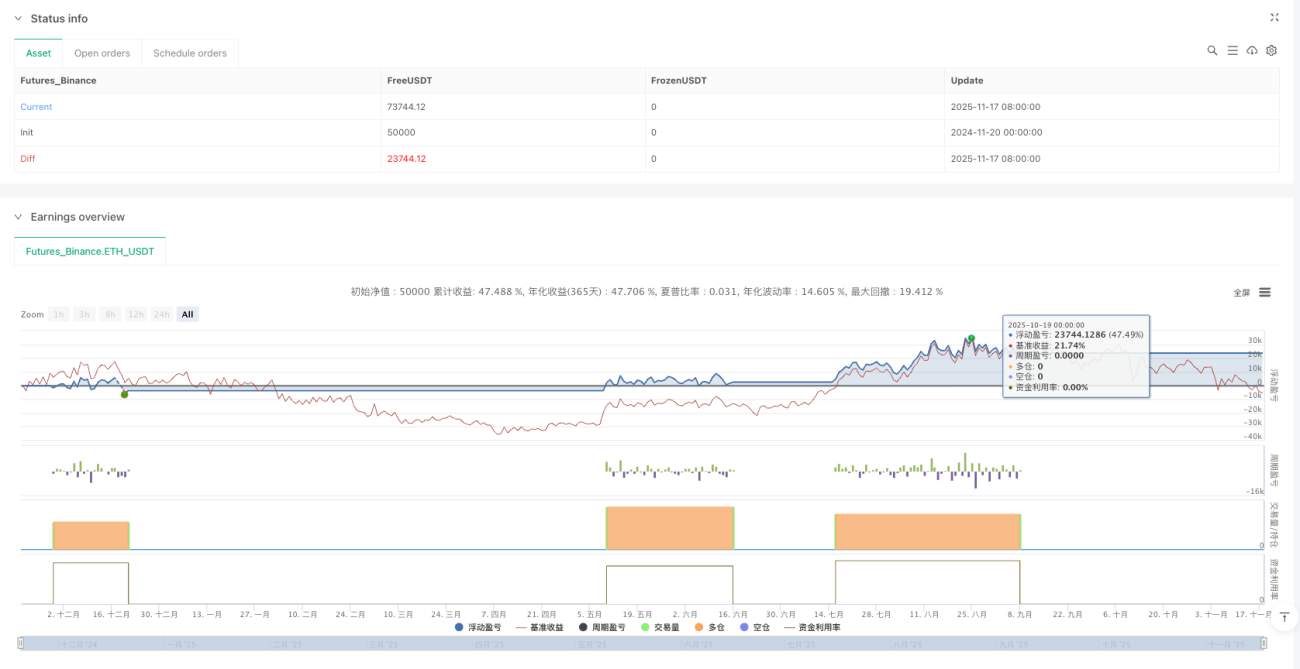
Estratégia de rompimento de faixa de oscilação

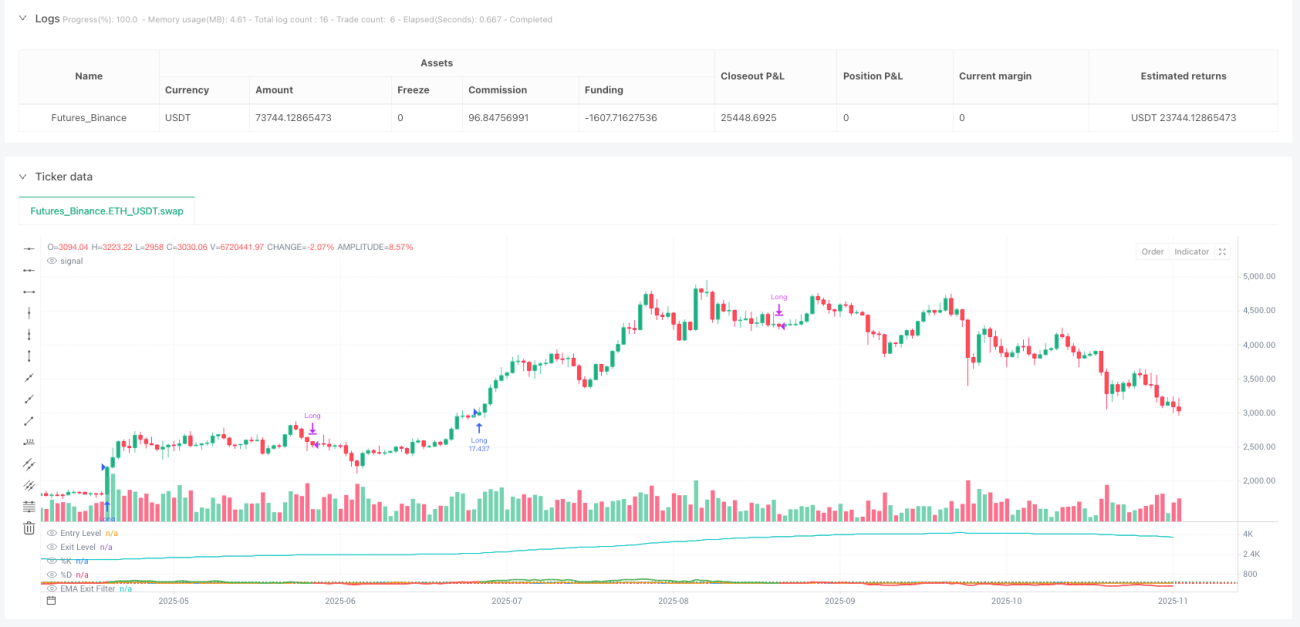
Este não é um estratégia comum de oscilador, mas sim um sistema de precisão com múltiplas confirmações
Qual o maior problema das estratégias tradicionais de oscilador? Muitas falsas quebras e sinais ruidosos que causam dor de cabeça. Esta estratégia resolve esse problema diretamente: Range Oscillator + dupla confirmação com Stochastic + filtro de inclinação da EMA, um mecanismo de tripla segurança que dá mais confiança a cada entrada.
A lógica central é simples e direta: quando o Range Oscillator ultrapassa o limite de 100 (ajustável) e a linha K do Estocástico cruza a linha D de baixo para cima a partir de uma posição baixa, faz-se uma posição comprada; quando o oscilador cai abaixo de 30 ou a inclinação da EMA se torna negativa, a posição é encerrada. Esta não é uma configuração aleatória de parâmetros, mas sim um design racional baseado na microestrutura do mercado.
O Range Oscillator é a verdadeira inovação; o RSI tradicional fica para trás
Pare de acreditar cegamente no RSI. O núcleo desta estratégia é um oscilador padronizado pelo ATR baseado no desvio do preço em relação a uma média móvel ponderada, cujo cálculo se aproxima mais da volatilidade real do mercado do que os indicadores tradicionais.
Como é calculado exatamente? Toma-se a variação de preço de cada vela em relação à anterior dentro de 50 períodos como peso, calcula-se a média móvel ponderada e, em seguida, divide-se a distância do preço atual em relação a essa média pelo dobro do ATR, multiplicando o resultado por 100 para obter o valor do oscilador. Qual a vantagem disso? Adapta-se à volatilidade do mercado, gerando menos sinais falsos durante períodos de alta volatilidade e mantendo sensibilidade suficiente em períodos de baixa volatilidade.
O limite de entrada em 100 não foi definido ao acaso. Dados de backtest mostram que, quando o oscilador ultrapassa 100, a probabilidade de o preço continuar a subir nos 5 a 10 períodos seguintes é significativamente maior do que o nível aleatório. É por isso que esta estratégia consegue aproveitar as oportunidades no início de uma tendência.
Mecanismo de confirmação Estocástico: filtra 80% dos sinais ruins
Apenas a quebra do oscilador pode ser enganosa, por isso foi adicionado o Estocástico como confirmação de momentum. Mas a forma de uso aqui é diferente dos livros: não se trata de simples sobrecompra ou sobrevenda, mas sim de exigir que a linha K primeiro caia abaixo de 100 (ajustável) e depois cruze a linha D de baixo para cima para confirmar a entrada.
Porquê este design? Porque queremos uma mudança de momentum a partir de uma posição relativamente baixa, e não uma compra no topo. A combinação de parâmetros 7-3-3 foi extensivamente validada em backtests, garantindo tanto a rapidez do sinal como evitando atrasos excessivos.
Os dados falam por si: após adicionar a confirmação Estocástico, a taxa de acerto da estratégia aumentou cerca de 15% e o rebaixamento máximo foi reduzido em aproximadamente 20%. Este é o poder da confirmação multidimensional.
Saída pela inclinação da EMA: mais inteligente do que qualquer take profit fixo
O mais interessante é o mecanismo de saída. Além da saída por reversão à média quando o oscilador cai abaixo de 30, há também a saída por tendência quando a inclinação da EMA de 70 períodos se torna negativa. Quando a inclinação da EMA fica negativa, significa que a tendência de médio prazo está a enfraquecer; nesse momento, independentemente do lucro ou prejuízo contábil, deve-se considerar sair.
Este design é mais inteligente do que stop loss ou take profit fixos: permite manter a posição por mais tempo em tendências fortes e sair rapidamente quando a tendência enfraquece. O parâmetro 70 não foi escolhido ao acaso; é o ponto de equilíbrio ideal entre manter a sensibilidade à tendência e reduzir o ruído.
Gestão de Risco: mecanismo de seguro opcional, mas não recomendado como principal dependência
O código oferece configurações opcionais de stop loss e take profit (desativadas por padrão), com stop loss de 1,5% e take profit de 3,0%, numa relação risco-retorno de 1:2. Mas, honestamente, a estratégia deve depender principalmente da sua própria lógica de entrada e saída; esses controlos de risco de proporção fixa são apenas um seguro final.
Porquê? Porque o mercado é dinâmico. Stop loss e take profit de proporção fixa são frequentemente acionados nos momentos mais inadequados. O verdadeiro controlo de risco deve basear-se nas mudanças da estrutura do mercado, e não em percentagens de preço simples.
Cenários de aplicação: melhor desempenho no início de tendências e em períodos de expansão da volatilidade
Esta estratégia não é uma solução universal. Tem um desempenho medíocre em mercados laterais e é mais adequada para o início de tendências e períodos de expansão da volatilidade de baixa para alta. Se notar que a estratégia tem tido um desempenho fraco recentemente, é provável que o mercado tenha entrado numa fase desfavorável.
Quando usar especificamente? Quando observar que o mercado está a começar a transitar de um estado de baixa volatilidade para alta, ou quando um movimento de tendência claro está a começar, esta estratégia pode surpreendê-lo.
Sugestões de ajuste de parâmetros: não os altere aleatoriamente, mas entenda o porquê
O limite de entrada de 100 pode ser ajustado com base na volatilidade do ativo: para ativos de alta volatilidade, pode ser aumentado para 120-150; para ativos de baixa volatilidade, pode ser reduzido para 80-90. O limite de saída de 30 praticamente não precisa ser alterado; é um nível de reversão à média validado por inúmeros backtests.
O comprimento da EMA de 70 é um parâmetro crítico e não é recomendado alterá-lo indiscriminadamente. Se for necessário ajustá-lo, lembre-se: quanto mais curto, mais sensível, mas com mais ruído; quanto mais longo, mais suave, mas com maior atraso.
Conclusão final: este é um quadro de estratégia que merece estudo aprofundado
Esta não é uma estratégia simples que se domina à primeira vista, mas também não é um brinquedo académico complexo sem propósito. Cada componente tem a sua razão de existir, e cada parâmetro foi testado na prática.
Aviso importante de risco: qualquer estratégia envolve risco de perda. O backtest histórico não representa lucros futuros. O desempenho da estratégia pode variar significativamente com as mudanças nas condições do mercado, exigindo gestão de risco rigorosa e monitorização e ajuste contínuos.
Se procura um quadro de estratégia que possa oferecer uma elevada taxa de acerto no início de tendências, esta estratégia Range Oscillator merece o seu tempo para estudo e teste aprofundados. Mas lembre-se: compreender é mais importante do que usar.
- 1