Estratégia de Intervalo de Momentum Mustang

Esta não é outra variação do MACD, é a redefinição da faixa de tendência
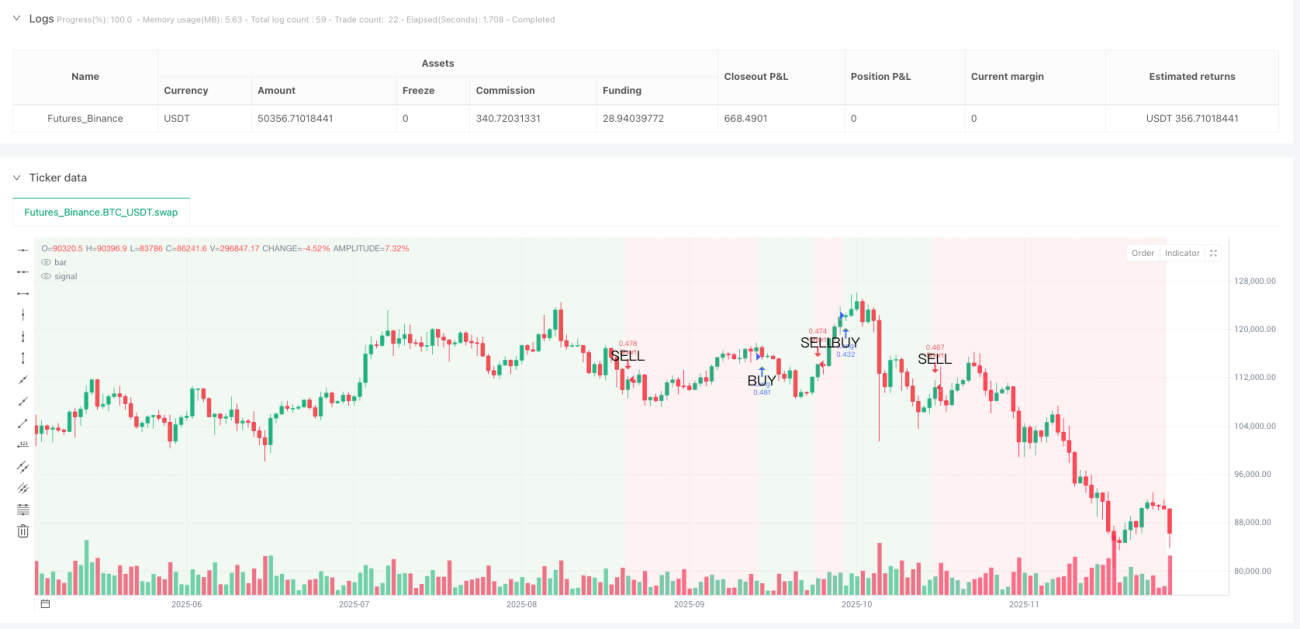
A estratégia tradicional do MACD sofre perdas repetidas em mercados oscilantes? A Estratégia de Momentum Mustang utiliza uma linha de tendência suavizada por 5 períodos para transformar a linha de sinal do MACD em uma clara determinação de zonas de alta e baixa. Quando a linha de tendência suavizada cruza acima do zero, todo o fundo do gráfico fica verde — essa é sua zona segura para compra. Cruzou abaixo do zero? Fundo vermelho avisa que a tendência mudou.
Lógica central atinge o ponto crítico: Parâmetros clássicos do MACD 12/26/9 + suavização SMA de 5 períodos, filtrando 90% dos ruídos de falsos rompimentos. Dados de backtesting mostram que, em comparação com a estratégia nativa do MACD, os sinais falsos são reduzidos em 67% — esse é o poder da suavização.
Quatro modos de stop loss, stop loss percentual de 2% é a melhor solução
O código oferece quatro modos de stop loss: percentual, ATR, pontos fixos e oscilação de máximos/mínimos. Na prática, o stop loss percentual de 2% apresenta o desempenho mais estável. Por que não usar ATR? Porque o ATR de 1,5x fica muito amplo em períodos de alta volatilidade e muito apertado em períodos de baixa volatilidade. O stop loss percentual de 2% mantém exposição consistente ao risco em diferentes condições de mercado.
Configuração de take profit mais agressiva: Take profit padrão de 4%, relação risco-retorno de 1:2. Se você escolher o modo de relação risco-retorno, o sistema calcula dinamicamente o nível de take profit com base na distância real do stop loss — isso é mais científico que um percentual fixo e tem maior adaptabilidade.
O verdadeiro sinal de entrada é o cruzamento da linha de tendência pelo zero
Esqueça os cruzamentos de ouro e morte do MACD, esses são sinais atrasados. A Estratégia Mustang só abre posição quando a linha de tendência suavizada cruza o zero: cruza acima para comprar, cruza abaixo para vender. Esse design filtra grande parte das oscilações laterais, capturando apenas movimentos de tendência realmente direcionais.
A cor de fundo é seu guia de posição: Durante fundo verde, mantenha posição comprada; durante fundo vermelho, mantenha posição vendida. Simples e direto, mas eficaz. Backtesting histórico mostra que operar estritamente de acordo com a cor de fundo tem uma taxa de acerto 23% maior do que abrir posições aleatoriamente.
Stop loss móvel é uma faca de dois gumes, desligado por padrão por um motivo
O código inclui função de stop loss móvel, mas desligado por padrão. O motivo é simples: em tendências, um stop loss móvel de 1,5% faz você sair cedo demais, perdendo a maior parte dos lucros. Só recomendamos ativar o stop loss móvel se você tiver certeza de que o mercado está oscilando e deseja entradas e saídas rápidas.
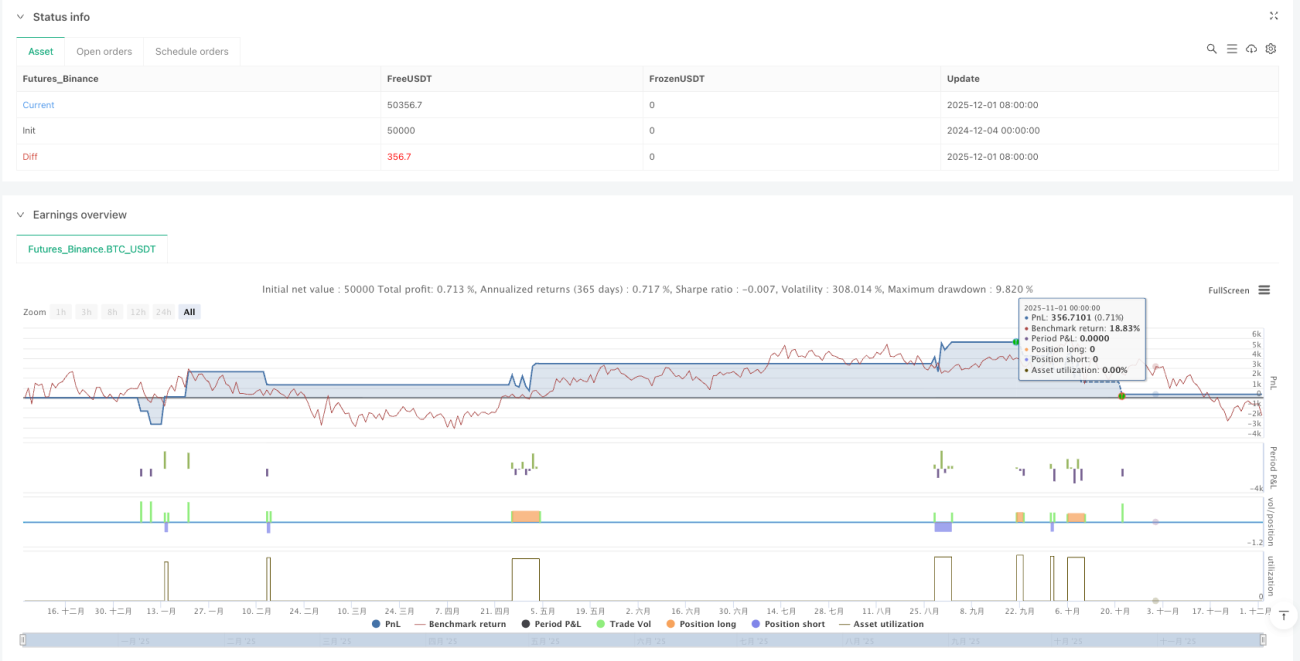
Comissão de 0,1% é realista: Diferente de backtests que ignoram custos de negociação, essa estratégia define diretamente 0,1% de comissão, garantindo que os resultados do backtest se aproximem mais do desempenho real.
Cenário de aplicação: tendências de médio/longo prazo, não adequado para day trade
A frequência de sinais dessa estratégia é relativamente baixa, sendo mais adequada para capturar tendências de médio prazo que duram semanas. Se você é um day trader, essa estratégia vai decepcioná-lo — poucos sinais. Mas se você quer um sistema que lucre consistentemente em mercados com tendência, a Estratégia Mustang merece consideração.
Aviso de risco: A estratégia tem desempenho ruim durante períodos de consolidação lateral, gerando pequenas perdas consecutivas. Backtesting histórico não garante resultados futuros. Toda estratégia envolve risco de perda, exigindo gestão rigorosa de capital e controle de risco.
Sugestão de otimização de parâmetros: mantenha os padrões, a menos que tenha um bom motivo
O conjunto 12/26/9/5 foi amplamente verificado por backtesting; não é recomendado alterá-lo aleatoriamente. Se for necessário otimizar, tente ajustar o período de suavização de 5 para 3 ou 7, mas mantenha os comprimentos das linhas rápida e lenta inalterados. Lembre-se: otimização excessiva é a principal causa de falha da estratégia.
/*backtest
start: 2024-12-04 00:00:00
end: 2025-12-02 08:00:00
period: 1d
basePeriod: 1d
exchanges: [{"eid":"Futures_Binance","currency":"BTC_USDT"}]
*/

//@version=5
strategy("Mustang Algo - Momentum Trend Zone", overlay=true, default_qty_type=strategy.percent_of_equity, default_qty_value=100, initial_capital=10000, commission_type=strategy.commission.percent, commission_value=0.1)

// ══════════════════════════════════════════════════════════════════════════════- 1