
Стратегия обратного отвода - это стратегия, использующая такие индикаторы, как средняя линия, MACD, RSI и ADX, для захвата тренда и обратного отвода в период обратного отвода. Она специально предназначена для радикальных монет и использует их обычные черты для обратного отвода.
Эта стратегия использует EMA для определения направления общей тенденции, а также для построения слабых зон тенденции. Когда цена оттягивается от сильных зон в слабые зоны, стратегия определяет, что существует возможность поворота тенденции.
Для фильтрации ошибочного ввода, стратегия включает MACD-индикатор для определения краткосрочного обратного сигнала. Когда абсолютные значения MACD превышают определенную величину, считается, что возможность обратного движения увеличивается. В то же время, требуется значение ADX выше определенного уровня, чтобы убедиться, что в настоящее время находится на рынке тренда, а не на рынке свертывания.
В конце концов, RSI помогает избежать перекупа и перепродажи. Сигналы RSI появляются только в определенных пределах.
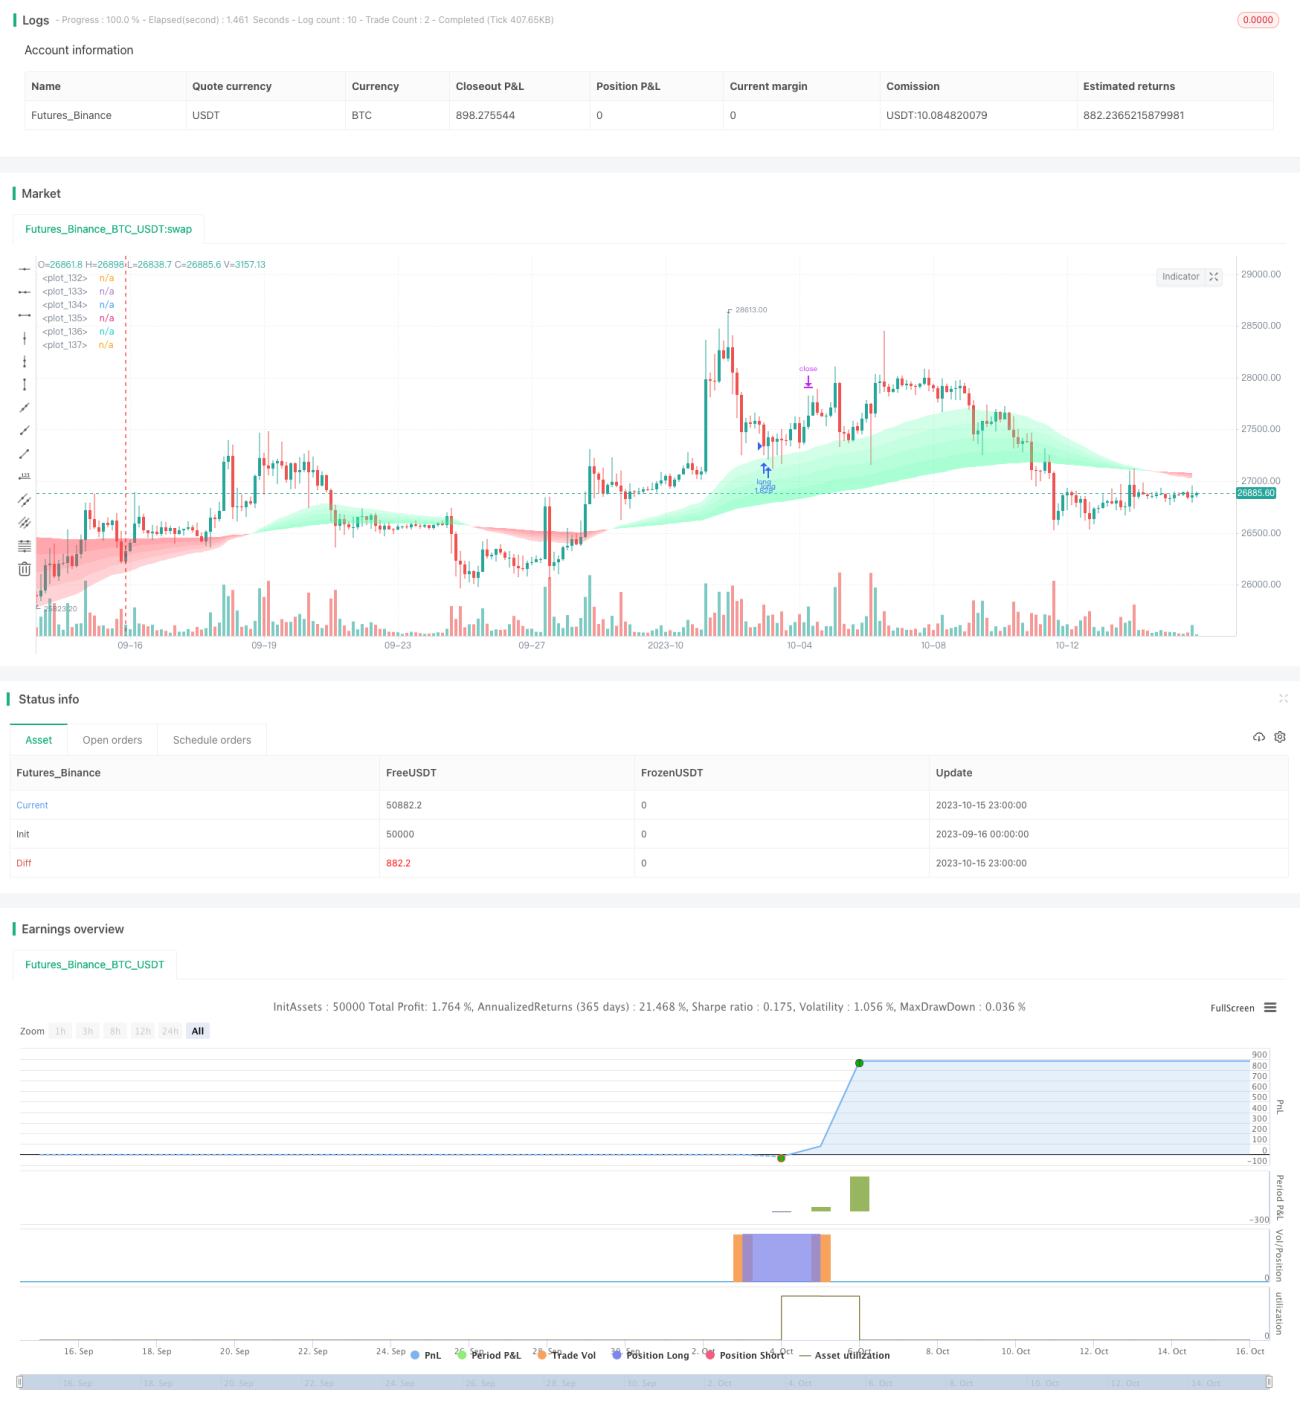
Каждый раз, когда средняя линия EMA пересекается, количество сделок стратегии очищается от нуля. Кроме того, можно установить максимальное количество сделок на каждом пересечении, чтобы избежать повторных сделок.
При выполнении условий устанавливается ордер на обратную сделку в соответствии с соотношением стоп-лосс и стоп-стоп.
Наибольшим преимуществом этой стратегии является использование созданных EMA-сильных и слабых зон, чтобы захватить характерные черты отталкивания радикального короля. Использование множества показателей фильтрации ошибочного входа, высокая надежность.
По сравнению с одиночным шоковым показателем, эта стратегия включает в себя тенденционное суждение, что позволяет уменьшить ненужный обрат. При этом контролируется максимальное количество сделок, которые пересекаются с каждой EMA, чтобы избежать повторных сделок с большими потерями.
Наибольший риск этой стратегии заключается в том, что коралл не отступает. Если коралл прямо прорывает EMA и продолжает расти или падать, стратегия дает ошибочный сигнал и вступает в реверсию. В этом случае требуется остановка для контроля убытков.
Кроме того, нерациональные параметры индикатора также могут привести к снижению качества сигнала. Необходимо повторно тестировать параметры оптимизации, чтобы они соответствовали различным рыночным условиям.
В конце концов, слишком большая стоп-магнитация или продолжение радикальных потрясений после обратного хода могут увеличить индивидуальные потери. Это требует разумного стоп-магнитации и усиления управления рисками.
Эта стратегия может быть оптимизирована в следующих аспектах:
Испытание различных рынков и параметров, позволяющих EMA более точно оценивать тенденции;
оптимизация параметров MACD для повышения точности и надежности обратного сигнала;
Применение диапазона RSI, чтобы избежать слишком радикальных зон перекупа и перепродажи;
Оптимизация Stop Loss Stop Loss Ratio, снижение риска одноразового убытка.
Стратегия “Вернуть назад” использует множество фильтров EMA для определения направления и силы тренда, а также для подтверждения входа в рынок с помощью таких показателей, как MACD, RSI и т. Д. Это очень практичная стратегия для изменения тренда, которая может быть адаптирована к различным рыночным условиям с помощью параметрового тестирования и оптимизации.
/*backtest
start: 2023-09-16 00:00:00
end: 2023-10-16 00:00:00
period: 3h
basePeriod: 15m
exchanges: [{"eid":"Futures_Binance","currency":"BTC_USDT"}]
*/
// This source code is subject to the terms of the Mozilla Public License 2.0 at https://mozilla.org/MPL/2.0/
// © npietronuto1
//@version=5
strategy("Hulk Scalper x35 Leverage", shorttitle = "Smash Pullback Strat", overlay=true, initial_capital=100, default_qty_type=strategy.percent_of_equity, default_qty_value=100)
//------------------------------------------------------------------------------------------------------------------------------------------------------------------------
//RSI
rsiLength = input.int(20)
RsiTopInput = input.int(2)
RsiBotInput = input.int(-2)
// toprsiLine = hline(RsiTopInput, title = "Rsi Top Line", linestyle = hline.style_solid)
// botrsiLine = hline(RsiBotInput, title = "Rsi Bottom Line", linestyle = hline.style_solid)
rsi = ta.rsi(close, rsiLength)
rsiWeighted = rsi - 50 //Zeros Rsi to look nicer
//------------------------------------------------------------------------------------------------------------------------------------------------------------------------
//------------------------------------------------------------------------------------------------------------------------------------------------------------------------
adxlen = input(14, title="ADX Smoothing")
dilen = input(14, title="DI Length")
dirmov(len) =>
up = ta.change(high)
down = -ta.change(low)
plusDM = na(up) ? na : (up > down and up > 0 ? up : 0)
minusDM = na(down) ? na : (down > up and down > 0 ? down : 0)
truerange = ta.rma(ta.tr, len)
plus = fixnan(100 * ta.rma(plusDM, len) / truerange)
minus = fixnan(100 * ta.rma(minusDM, len) / truerange)
[plus, minus]
adx(dilen, adxlen) =>
[plus, minus] = dirmov(dilen)
sum = plus + minus
adx = 100 * ta.rma(math.abs(plus - minus) / (sum == 0 ? 1 : sum), adxlen)
sig = adx(dilen, adxlen)
ADXfilterlevel = input.int(33, title = "ADX filter amount")
// plot(sig, color=color.red, title="ADX")
//------------------------------------------------------------------------------------------------------------------------------------------------------------------------
//------------------------------------------------------------------------------------------------------------------------------------------------------------------------
//MACD
FastMacdLength = input.int(12, group = "MACD")
SlowMacdLength = input.int(26, group = "MACD")
SignalLength = input.int(11, group = "MACD")
MacdTickAmountNeeded = input.float(5.45, title = "Tick Amount for entry", group = "MACD")
res = input.timeframe("1", group = "MACD")
// bullishgrow_col = input.color(defval = #3179f5)
// bullishweaken_col = input.color(defval = #00e1ff)
// bearishweaken_col = input.color(defval = #ff01f1)
// bearishgrow_col = input.color(defval = #9d00e5)
[FastMacd, SlowMacd, Macdhist] = ta.macd(close, FastMacdLength, SlowMacdLength, SignalLength)
//Pull MACD from Lower timeframe
MACD = request.security(syminfo.tickerid, res, Macdhist, gaps = barmerge.gaps_on)
//Grow and Fall Color
// getgrow_fall_col(Value) =>
// if Value >= 0
// if Value >= Value[1]
// color.new(bullishgrow_col, transp = 10)
// else if Value <= Value[1]
// color.new(bullishweaken_col, transp = 10)
// else if Value <= 0
// if Value <= Value[1]
// color.new(bearishgrow_col, transp = 10)
// else if Value >= Value[1]
// color.new(bearishweaken_col, transp = 10)
//CONDITIONS that check if MACD is overbought or oversold
MACDisAboveBand = MACD > MacdTickAmountNeeded
MACDisBelowBand = MACD < MacdTickAmountNeeded*-1
//Plot
// plot(MACD, style = plot.style_columns, color = getgrow_fall_col(MACD))
//------------------------------------------------------------------------------------------------------------------------------------------------------------------------
//------------------------------------------------------------------------------------------------------------------------------------------------------------------------
//EMAs
//Inputs
EmaFastLength = input.int(50, title = "Ema Fast Length")
EmaSlowLength = input.int(200, title = "Ema Slow Length")
StrongUpTrendCol = input.color(color.rgb(74, 255, 163))
//WeakUptrend = input.color(color.rgb(74, 255, 163, 50))
StrongDownTrendCol = input.color(color.rgb(255, 71, 84))
//WeakDownTrend = input.color(color.rgb(255, 71, 84, 50))
//Calculations
emaFast= ta.ema(close, EmaFastLength)
emaSlow= ta.ema(close, EmaSlowLength)
emaDist=emaFast-emaSlow
EmaLengthFraction = emaDist/4
emafrac5 = emaSlow + EmaLengthFraction
emafrac4 = emaSlow + EmaLengthFraction*2
emafrac3 = emaSlow + EmaLengthFraction*3
emafrac2 = emaSlow + EmaLengthFraction*4
UptrendCol_DowntrendCol= emaFast>=emaSlow ? StrongUpTrendCol:StrongDownTrendCol
//Plot
ema1p = plot(emaFast, color = color.new(#000000, transp = 100))
ema2p = plot(emafrac2, color = color.new(#000000, transp = 100))
ema3p = plot(emafrac3, color = color.new(#000000, transp = 100))
ema4p = plot(emafrac4, color = color.new(#000000, transp = 100))
ema5p = plot(emafrac5, color = color.new(#000000, transp = 100))
ema6p = plot(emaSlow, color = color.new(#000000, transp = 100))
fill(ema2p,ema3p, color = color.new(UptrendCol_DowntrendCol, 70))
fill(ema3p,ema4p, color = color.new(UptrendCol_DowntrendCol, 60))
fill(ema4p,ema5p, color = color.new(UptrendCol_DowntrendCol, 50))
fill(ema5p,ema6p, color = color.new(UptrendCol_DowntrendCol, 40))
//Conditons
FastEma_above_SlowEma = emaFast > emaSlow
FastEma_below_SlowEma = emaFast < emaSlow
emaCrossEvent = ta.crossover(emaFast, emaSlow) or ta.crossover(emaSlow, emaFast)
//------------------------------------------------------------------------------------------------------------------------------------------------------------------------
//------------------------------------------------------------------------------------------------------------------------------------------------------------------------
//Trade Cap per EMA X
//Inputs
MaxTrades_PerCross_Checkbox = input.bool(true, "Limit Trades Per Cross", group = "Filters")
TrdCount = 0//Variable that keeps current trade count
if(TrdCount[1] > 0)//Passes variable on to current candle
TrdCount := TrdCount[1]
//Reset trade count if EMAs X
emaXevent = ta.crossover(emaFast, emaSlow) or ta.crossover(emaSlow, emaFast) // Check for EMA cross
if(emaXevent)
TrdCount := 0
//Conditions
MaxTrades = input.int(6)
IsMaxTrades_BelowCap = TrdCount[1] < MaxTrades //Condition that applies max trade count
if(not MaxTrades_PerCross_Checkbox)
IsMaxTrades_BelowCap := true
//------------------------------------------------------------------------------------------------------------------------------------------------------------------------
//------------------------------------------------------------------------------------------------------------------------------------------------------------------------
//STRATEGY LOGIC
//Parameters
TakeProfitInput = input.float(0.0135, title = "Take Profit %", group = "TP/SL")
StopLossInput = input.float(0.011, title = "Stop Loss %", group = "TP/SL")
//TP/SL calculations
Long_takeProfit = close * (1 + TakeProfitInput)
Long_stopLoss = close * (1 - StopLossInput)
Short_takeProfit = close * (1 - TakeProfitInput)
Short_stopLoss = close * (1 + StopLossInput)
//LONG and Short
LongConditionPt1 = close > emaSlow and MACDisBelowBand and sig > ADXfilterlevel
LongConditionPt2 = FastEma_above_SlowEma and IsMaxTrades_BelowCap and strategy.position_size == 0
//Checks if Rsi Inbetween Lines
LongConditionPt3 = rsiWeighted < RsiTopInput and rsiWeighted > RsiBotInput
ShortConditionPt1 = close < emaSlow and MACDisAboveBand and sig > ADXfilterlevel
ShortConditionPt2 = FastEma_below_SlowEma and IsMaxTrades_BelowCap and strategy.position_size == 0
//Checks if Rsi Inbetween Lines
ShortConditionPt3 = rsiWeighted < RsiTopInput and rsiWeighted > RsiBotInput
// longCondition = FastEma_above_SlowEma and MACDisBelowBand and IsMaxTrades_BelowCap and rsiWeighted < RsiTopInput and strategy.position_size == 0
longCondition = LongConditionPt1 and LongConditionPt2 and LongConditionPt3
if(longCondition)
strategy.entry("long", strategy.long)
strategy.exit("exit", "long", limit = Long_takeProfit, stop = Long_stopLoss)
TrdCount := TrdCount + 1//ADD to Max Trades Count
alert("Go Long with TP at" + str.tostring(Long_takeProfit) + "and SL at" + str.tostring(Long_stopLoss), alert.freq_once_per_bar_close)
shortCondition = ShortConditionPt1 and ShortConditionPt2 and ShortConditionPt3
if(shortCondition )
strategy.entry("short", strategy.short)
strategy.exit("exit", "short", limit = Short_takeProfit, stop = Short_stopLoss)
TrdCount := TrdCount + 1 //ADD to Max Trades Count
alert("Go Short with TP at" + str.tostring(Short_takeProfit) + "and SL at" + str.tostring(Short_stopLoss), alert.freq_once_per_bar_close)