
Эта стратегия использует в основном индикатор пробега каналов Цзяндунчжиань, чтобы реализовать стратегию слежения за прорывом. Эта стратегия сочетает в себе два типа торговых идей: тренд и прорыв. На основе суждения о длинных тенденциях, она ищет точки прорыва с более короткими периодами, чтобы совершать входные сделки в трендовых условиях.
параметры для установки индикатора пропуска на канале Цзяндун, по умолчанию 20 циклов;
Настройка EMA с гладкой движущейся средней линией, по умолчанию 200 циклов;
По умолчанию - 1,5.
Параметры прорыва и отступления устанавливаются в виде многоголовых и пустых параметров;
Если вы не можете определить, когда произойдет прорыв, то вы должны знать, когда он произойдет.
многоголовый сигнал: если предыдущий прорыв был низким, и цена была выше верхней линии Донцзяна и выше средней линии EMA, генерируйте многоголовый сигнал;
Стрелок: если предыдущий прорыв был высоким, и цена была ниже нижней полосы Тоньцзяна и ниже средней линии EMA, генерировать стрелок;
После входа в многоочередную позицию, установка стоп-убытков на отступ в 5 пунктов ниже рельса Дончжана, стоп-остановка на риск-прибыль умноженный на стоп-расстояние;
После вхождения в пустую позицию, установка стоп-лосса на отступление на 5 пунктов вверх по Доньцзяну, а стоп-стоп - на риск-прибыль умноженный на стоп-дальность.
Таким образом, стратегия в сочетании с трендовым суждением и прорывными операциями позволяет попеременно ловить возможности более коротких периодов в длиннолинейных тенденциях. В то же время, установка стоп-стоп может контролировать риск-прибыль отдельных сделок.
Следите за длинными линиями, чтобы избежать обратной торговли.
В качестве долголинейного индикатора используется канал Донцзяна, который в сочетании с однолинейным фильтром EMA позволяет лучше определить направление тренда.
Механизмы сдерживания убытков контролируют каждый риск и ограничивают возможные потери.
Оптимизируйте риск-прибыль, увеличьте убытки и стремитесь к дополнительной прибыли.
Гибкая настройка параметров отслеживания позволяет адаптировать оптимальное сочетание параметров для разных рынков.
В качестве фильтрующих показателей используются каналы Донцзяна и EMA, что может привести к ошибочным сигналам.
Прорывные сделки легко поддаются фальсификации и требуют четкого определения трендового фона.
Стоп-стоп имеет фиксированную дистанцию и не может корректироваться в зависимости от колебаний рынка.
Parameters Оптимизируемое пространство ограничено, а эффективность жесткого диска не гарантирована.
Торговая система не может выдержать испытания слишком большим количеством случайных событий, а черные лебеди могут привести к большим потерям.
Можно рассмотреть возможность добавления дополнительных показателей для фильтрации, например, показателей колебаний, улучшения качества сигнала.
Можно установить интеллектуальный стоп-стоп, чтобы скорректировать позицию прибыли и убытка в зависимости от степени волатильности рынка и динамики ATR.
Для тестирования и оптимизации параметров можно использовать методы, такие как машинное обучение, чтобы приблизить их к реальному рынку.
Можно оптимизировать логику входа, установив VOLUME или показатель волатильности в качестве вспомогательных условий, чтобы избежать ловушки.
Можно рассмотреть возможность использования в сочетании с стратегией отслеживания тенденций или машинным обучением для создания смешанных стратегий, повышающих стабильность.
Эта стратегия является стратегией слежения за прорывом, основная идея заключается в том, чтобы определить длинную линию тенденции, чтобы прорваться в качестве сигнала и установить стоп-стоп для контроля риска в одной сделке. У этой стратегии есть определенные преимущества, но также есть некоторые возможности для оптимизации. В целом, если она может хорошо обрабатывать параметры, выбор времени входа в игру и другие вопросы, а также дополняется другими технологиями, эта стратегия может стать практической стратегией отслеживания тенденций.
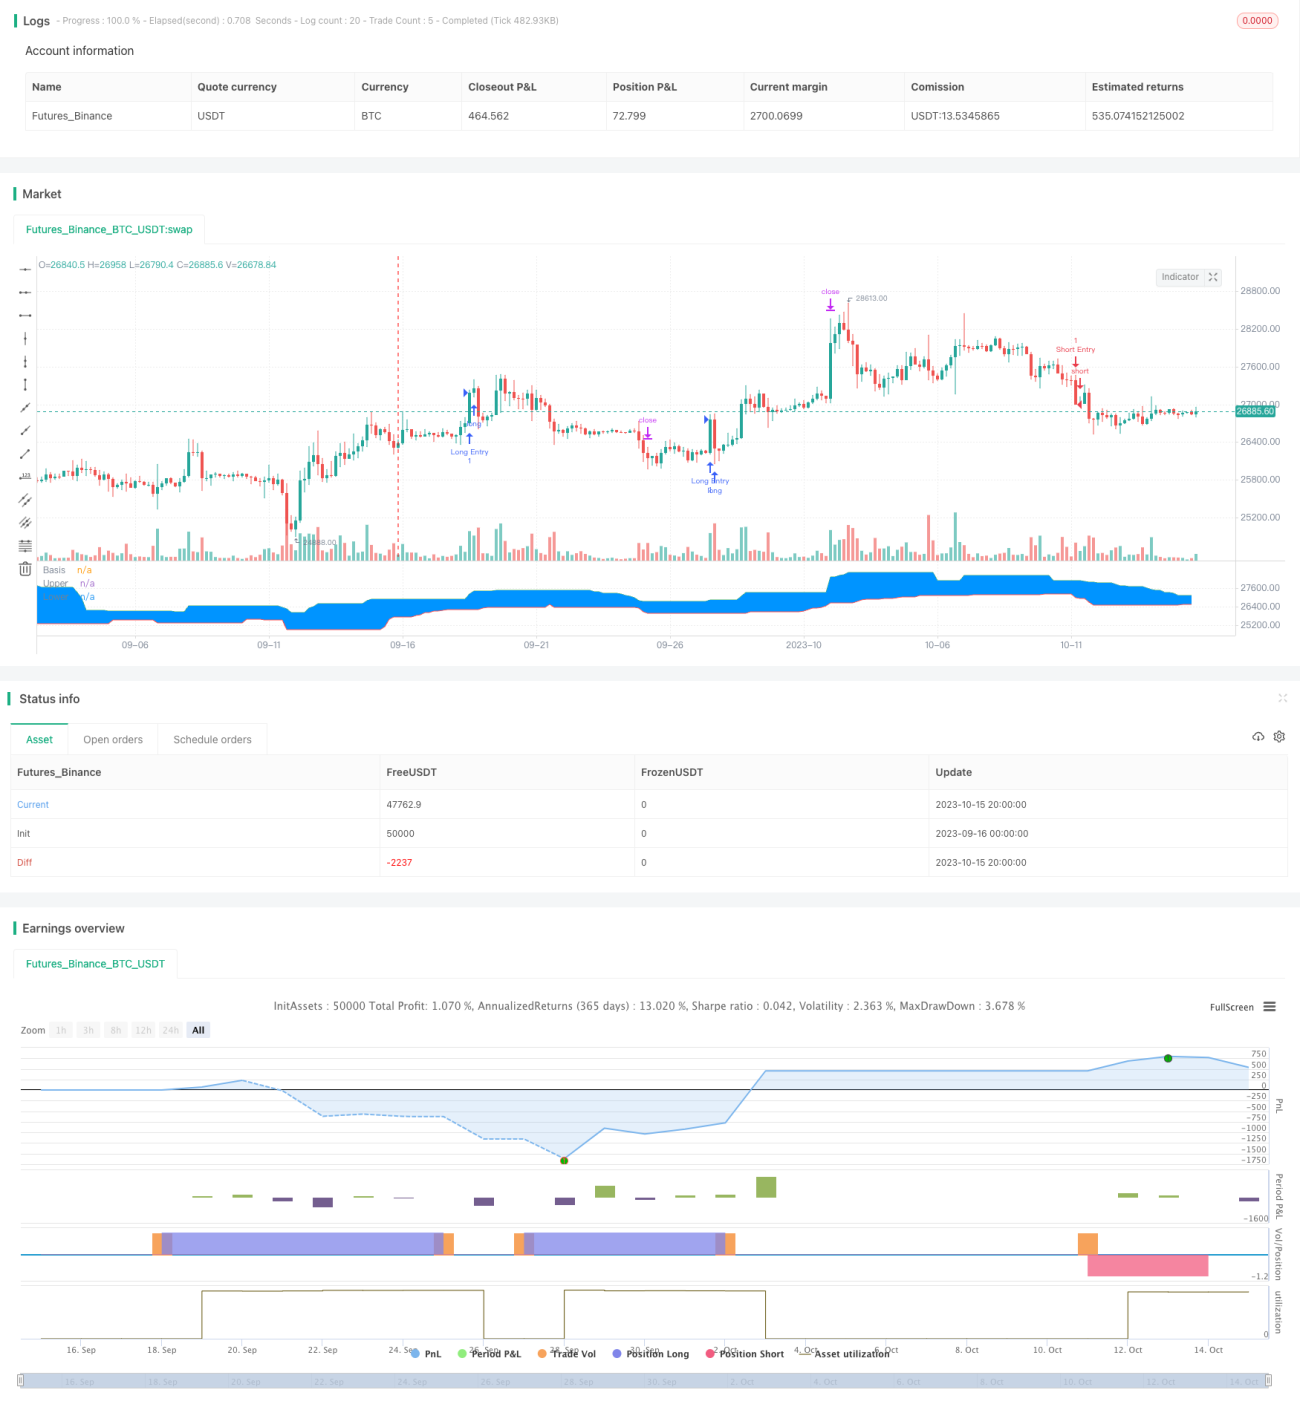
/*backtest
start: 2023-09-16 00:00:00
end: 2023-10-16 00:00:00
period: 4h
basePeriod: 15m
exchanges: [{"eid":"Futures_Binance","currency":"BTC_USDT"}]
*/
//@version=4
// Welcome to my second script on Tradingview with Pinescript
// First of, I'm sorry for the amount of comments on this script, this script was a challenge for me, fun one for sure, but I wanted to thoroughly go through every step before making the script public
// Glad I did so because I fixed some weird things and I ended up forgetting to add the EMA into the equation so our entry signals were a mess
// This one was a lot tougher to complete compared to my MACD crossover trend strategy but I learned a ton from it, which is always good and fun
// Also I'll explain the strategy and how I got there through some creative coding(I'm saying creative because I had to figure this stuff out by myself as I couldn't find any reference codes)
// First things first. This is a Donchian Channel Breakout strategy which follows the following rules
// If the price hits the upperband of the Donchian Channel + price is above EMA and the price previously hit the lowerband of the Donchian Channel it's a buy signal
// If the price hits the lowerband of the Donchian Channel + price is below EMA and the price prevbiously hit the upper band of the Donchian Channel it's a sell signal
// Stop losses are set at the lower or upper band with a 0.5% deviation because we are acting as if those two bands are the resistance in this case
// Last but not least(yes, this gave BY FAR the most trouble to code), the profit target is set with a 1.5 risk to reward ratio
// If you have any suggestions to make my code more efficient, I'll be happy to hear so from you
// So without further ado, let's walk through the code
// The first line is basically standard because it makes backtesting so much more easy, commission value is based on Binance futures fees when you're using BNB to pay those fees in the futures market
// strategy(title="Donchian Channels", shorttitle="DC", overlay=true, default_qty_type = strategy.cash, default_qty_value = 150, initial_capital = 1000, currency = currency.USD, commission_type = "percent", commission_value = 0.036)
// The built-in Donchian Channels + an added EMA input which I grouped with the historical bars from the Donchian Channels
length = input(20, minval=1, group = "Indicators")
lower = lowest(length)
upper = highest(length)
basis = avg(upper, lower)
emaInput = input(title = "EMA Input", type = input.integer, defval = 200, minval = 10, maxval = 400, step = 1, group = "Indicators")
// I've made three new inputs, for risk/reward ratio and for the standard pullback deviation. My advise is to not use the pullback inputs as I'm not 100% sure if they work as intended or not
riskreward = input(title = "Risk/Reward Ratio", type = input.float, defval = 1.50, minval = 0.01, maxval = 100, step = 0.01, group = "Risk/Reward")
pullbackLong = input(title = "Distance from Long pullback %", type = input.float, defval = 0.995, minval = 0.001, maxval = 2, step = 0.001, group = "Risk/Reward")
pullbackShort = input(title = "Distance from Short pullback %", type = input.float, defval = 1.005, minval = 0.001, maxval = 2, step = 0.001, group = "Risk/Reward")
// Input backtest range, you can adjust these in the input options, just standard stuff
fromMonth = input(defval = 1, title = "From Month", type = input.integer, minval = 1, maxval = 12, group = "Backtest Date Range")
fromDay = input(defval = 1, title = "From Day", type = input.integer, minval = 1, maxval = 31, group = "Backtest Date Range")
fromYear = input(defval = 2000, title = "From Year", type = input.integer, minval = 1970, group = "Backtest Date Range")
thruMonth = input(defval = 1, title = "Thru Month", type = input.integer, minval = 1, maxval = 12, group = "Backtest Date Range")
thruDay = input(defval = 1, title = "Thru Day", type = input.integer, minval = 1, maxval = 31, group = "Backtest Date Range")
thruYear = input(defval = 2099, title = "Thru Year", type = input.integer, minval = 1970, group = "Backtest Date Range")
// Date variable also standard stuff
inDataRange = (time >= timestamp(syminfo.timezone, fromYear, fromMonth, fromDay, 0, 0)) and (time < timestamp(syminfo.timezone, thruYear, thruMonth, thruDay, 0, 0))
// I had to makes these variables because the system has to remember whether the previous 'breakout' was a high or a low
// Also, because I based my stoploss on the upper/lower band of the indicator I had to find a way to change this value just once without losing the value, that was added, on the next bar
var previousishigh = false
var previousislow = false
var longprofit = 0.0
var shortprofit = 0.0
var stoplossLong = 0.0
var stoplossShort = 0.0
// These are used as our entry variables
emaCheck = ema(close, emaInput)
longcond = high >= upper and close > emaCheck
shortcond = low <= lower and close < emaCheck
// With these two if statements I'm changing the boolean variable above to true, we need this to decide out entry position
if high >= upper
previousishigh := true
if low <= lower
previousislow := true
// Made a last minute change on this part. To clean up our entry signals we don't want our breakouts, while IN a position, to change. This way we do not instantly open a new position, almost always in the opposite direction, upon exiting one
if strategy.position_size > 0 or strategy.position_size < 0
previousishigh := false
previousislow := false
// Strategy inputs
// Long - previous 'breakout' has to be a low, the current price has to be a new high and above the EMA, we're not allowed to be in a position and ofcourse it has to be within our given data for backtesting purposes
if previousislow == true and longcond and strategy.position_size == 0 and inDataRange
strategy.entry("Long Entry", strategy.long, comment = "Entry Long")
stoplossLong := lower * pullbackLong
longprofit := ((((1 - stoplossLong / close) * riskreward) + 1) * close)
strategy.exit("Long Exit", "Long Entry", limit = longprofit, stop = stoplossLong, comment = "Long Exit")
// Short - Previous 'breakout' has to be a high, current price has to be a new low and lowe than the 200EMA, we're not allowed to trade when we're in a position and it has to be within our given data for backtesting purposes
if previousishigh == true and shortcond and strategy.position_size == 0 and inDataRange
strategy.entry("Short Entry", strategy.short, comment = "Entry Short")
stoplossShort := upper * pullbackShort
shortprofit := (close - ((((1 - close / stoplossShort) * riskreward) * close)))
strategy.exit("Short Exit", "Short Entry", limit = shortprofit, stop = stoplossShort, comment = "Short Exit")
// This plots the Donchian Channels on the chart which is just using the built-in Donchian Channels
plot(basis, "Basis", color=color.blue)
u = plot(upper, "Upper", color=color.green)
l = plot(lower, "Lower", color=color.red)
fill(u, l, color=#0094FF, transp=95, title="Background")
// These plots are to show if the variables are working as intended, it's a mess I know but I didn't have any better ideas, they work well enough for me
// plot(previousislow ? close * 0.95 : na, color=color.red, linewidth=2, style=plot.style_linebr)
// plot(previousishigh ? close * 1.05 : na, color=color.green, style=plot.style_linebr)
// plot(longprofit, color=color.purple)
// plot(shortprofit, color=color.silver)
// plot(stoplossLong)
// plot(stoplossShort)
// plot(strategy.position_size)