Многофакторные количественные торговые стратегии

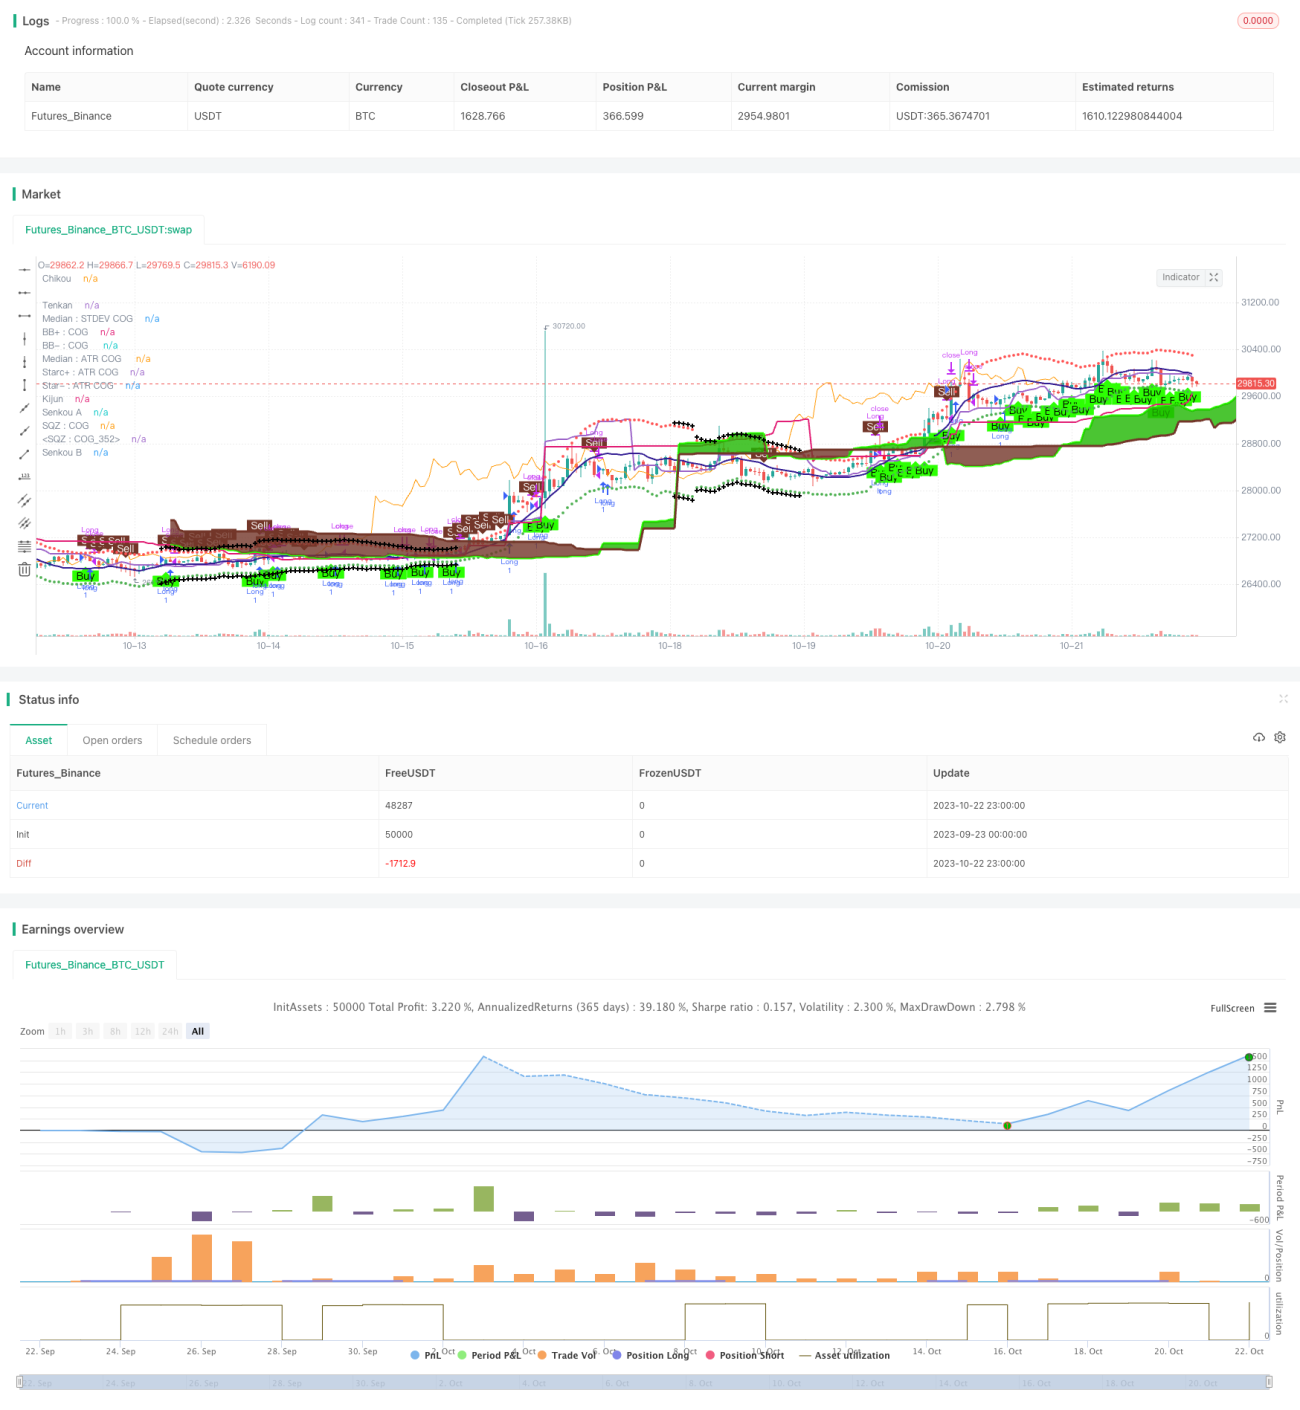
Это количественная торговая стратегия, в которой используются различные технические показатели для выработки позитивных суждений. Эта стратегия учитывает множество факторов, таких как динамические показатели, трендовые показатели и графики облака Ичимоку, для формирования окончательного решения о покупке или продаже. Эта стратегия обладает большой стабильностью и устойчивостью к риску.
Принципиальный анализ
Стратегия состоит из следующих частей:
-
Показатели динамики: Parabolic SAR, показатель напряженности Leledc, адаптированная движущаяся средняя Kaufman и др.
-
Тренд-индикаторы: Рахул Мохиндар, Trend Magic и другие
-
Карта облаков Ичимоку: включает в себя линии Тенкан, Киджун и другие
-
Индикатор объема потока
-
Оциллятор Wave Trend
-
Последовательность TD
Эти индикаторы различно оценивают текущие тенденции и силы рынка. Параболический SAR оценивает обратную точку тренда, индикатор силы Ledc оценивает момент, график облака Ичимоку оценивает давление на поддержку.
Вместе с тем, стратегия устанавливает фильтрационные условия, позволяющие совершать сделки только в пределах установленного диапазона ежемесячных и ежедневных дат, что снижает количество недействительных сделок.
Анализ преимуществ
-
Многофакторное комплексное суждение, повышенная точность, более сильная устойчивость к риску
-
Использование различных типов показателей для перекрестной проверки, чтобы избежать риска сбоя одного показателя
-
Установка фильтров для предотвращения недействительных сделок в неподходящий период времени
-
Письменность, написанная с помощью Pine Script, может быть использована непосредственно на платформе TradingView, что делает ее удобной и быстрой
-
Параметры индикатора могут быть изменены и оптимизированы для различных рынков
-
Визуализация индикаторных сигналов, интуитивное определение структуры рынка
Анализ рисков
-
Многофакторные комбинации требуют корректировки весов и параметров, существует определенная сложность оптимизации
-
Единый показатель может быть неэффективным в определенных рыночных условиях
-
Неправильные условия фильтрации могут привести к упущенным возможностям
-
Осторожно, чтобы не быть слишком оптимизированным
-
Трейдеры должны быть внимательны к рискам неудачи индикаторов и своевременно корректировать стратегию
Ответ:
-
Оптимизация параметров корректировки показателя, чтобы сделать его более эффективным для текущего рынка
-
Регулирование веса, увеличение эффективных показателей, снижение неэффективных показателей
-
Своевременная корректировка фильтрационных условий с учетом возможностей и рисков
Оптимизация
-
Добавление алгоритмов машинного обучения для автоматической настройки веса показателей
-
Повышение эмоциональных показателей, показателей денежных потоков и т.д.
-
Тестирование на торговые виды и периоды времени с установлением оптимальных параметров
-
Тестирование эффективности различных периодов хранения
-
С помощью дополнительных фильтров, таких как сезонность, экономические данные и т.д.
-
Добавление стратегии стоп-лосса
Подвести итог
Эта стратегия объединяет несколько показателей для формирования окончательного решения, обладает сильным преимуществом устойчивости к риску. В то же время, необходимо обратить внимание на риск неудачи одного показателя, постоянную оптимизацию и корректировку параметров. В будущем можно дополнительно оптимизировать настройку весов показателей, добавить больше факторов, тестировать оптимальный период удержания позиций и т. Д.
//@version=2
persistent_bull = nz(persistent_bull[1],0)
persistent_bear  = nz(persistent_bear[1],0)

strategy("Strategy for The Bitcoin Buy/Sell Indicator", overlay=true, calc_on_every_tick=true)

// ****************************************Inputs***************************************************************
//@fixme if there is a buy and sell signal on the same bar, then it displays the first one and skips the second one. Fix this issue
buySellSignal = true // Make this false if you do not want to show Buy/Sell signal
inputIndividualSiganlPlot = true // = input (false, "Do you want to display each individual indicator's signal on the chart?")
sp = input (false, "Do you want to display Parabolic SAR?")
spLines = input (false, "Do you want to display Parabolic SAR on the chart?")- 1