Стратегия Breakout Trailing Stop V2


Дата создания: 2023-10-24 16:30:32 Последнее изменение: 2023-10-24 16:30:32
Копировать: 0 Количество просмотров: 1615
1
Подписаться
1617
Подписчики

Стратегия Breakout Trailing Stop V2

Обзор

Эта стратегия объединяет преимущества стратегии прорыва и стратегии отслеживания тренда, чтобы захватить сигналы прорыва сопротивления поддержке на графике длинных линий, а также использовать движущиеся средние для отслеживания остановок, чтобы получить прибыль в направлении длинных тенденций, контролируя при этом риск.

Стратегический принцип

  1. Сначала стратегия рассчитывает скользящие средние для нескольких групп различных параметров, которые используются для определения тенденции, поддержки сопротивления и отслеживания убытков.

  2. Затем выясняется, где находятся максимальные и минимальные точки в течение заданного периода, которые являются зонами поддержки и сопротивления для входа в рынок. Сигналы появляются, когда цена преодолевает эти поддерживающие и сопротивляющие точки.

  3. Стратегия покупает на прорывный максимум, чтобы сделать много сигналов, и продает на прорывный минимум, чтобы сделать короткий сигнал.

  4. После входа в рынок, мы будем держать позицию в качестве стоп-лосса с низкой точкой прорыва.

  5. После того, как позиция переходит в выигрышный режим, остановка превращается в отслеживание движущейся средней. Когда цена падает ниже движущейся средней, остановка устанавливается как самая низкая точка на этой корневой линии K.

  6. Таким образом, можно закрепить прибыль, оставляя при этом достаточно места для позиций, чтобы отслеживать тенденции.

  7. Стратегия одновременно включает в себя средние реальные колебания, чтобы гарантировать, что прорыв покупается только в подходящем диапазоне, чтобы избежать прорыва чрезмерного расширения.

Анализ преимуществ стратегии

  1. Двойное преимущество стратегии по предотвращению убытков в сочетании с стратегией прорыва и стратегией отслеживания тенденций.

  2. Это означает, что вы можете купить прорыв в соответствии с длинной линией тренда и увеличить вероятность получения прибыли.

  3. Стоп-стратегия защищает позицию и дает ей достаточно пространства для работы.

  4. Добавление фильтра на колебания, чтобы избежать неблагоприятных прорывов, которые могут привести к чрезмерному росту.

  5. Автоматизированная торговля, подходит для частичного расчета времени.

  6. Можно настроить различные циклические средние линии для операций.

  7. Гибкость в отслеживании убытков.

Анализ стратегических рисков

  1. Стратегия взлома подвержена риску ложного взлома.

  2. Необходимо достаточное количество колебаний для создания прорывного сигнала, который может быть недействителен при перевернутом режиме.

  3. Некоторые прорывы могут быть слишком короткими, чтобы их можно было поймать.

  4. Следить за остановками, которые могут быть слишком частыми при шокирующих событиях.

  5. Фильтрация частоты колебаний может пропустить некоторые возможности. Можно снизить параметры фильтрации.

Направление оптимизации стратегии

  1. Тестируйте различные комбинации среднелинейных параметров, чтобы найти оптимальные.

  2. Тестирование различных механизмов подтверждения прорыва, таких как каналы, K-линии и т. д.

  3. Попробуйте различные методы отслеживания убытков, чтобы найти оптимальный вариант.

  4. Оптимизация стратегий управления капиталом, таких как позиционная оценка.

  5. Добавление фильтрации по статистическим показателям повышает точность фильтрации.

  6. Подобная стратегия может быть использована для тестирования эффективности различных сортов.

  7. Включение алгоритмов машинного обучения повышает эффективность стратегии.

Подвести итог

Стратегия, объединяющая взломовую мысль и мысль о том, чтобы отслеживать тенденции, позволяет оптимизировать пространство для прибыли при условии правильного определения длинной линии. Ключ в том, чтобы найти оптимальную комбинацию параметров и совместить с хорошей стратегией управления капиталом, чтобы одновременно использовать длинные возможности и контролировать риск.
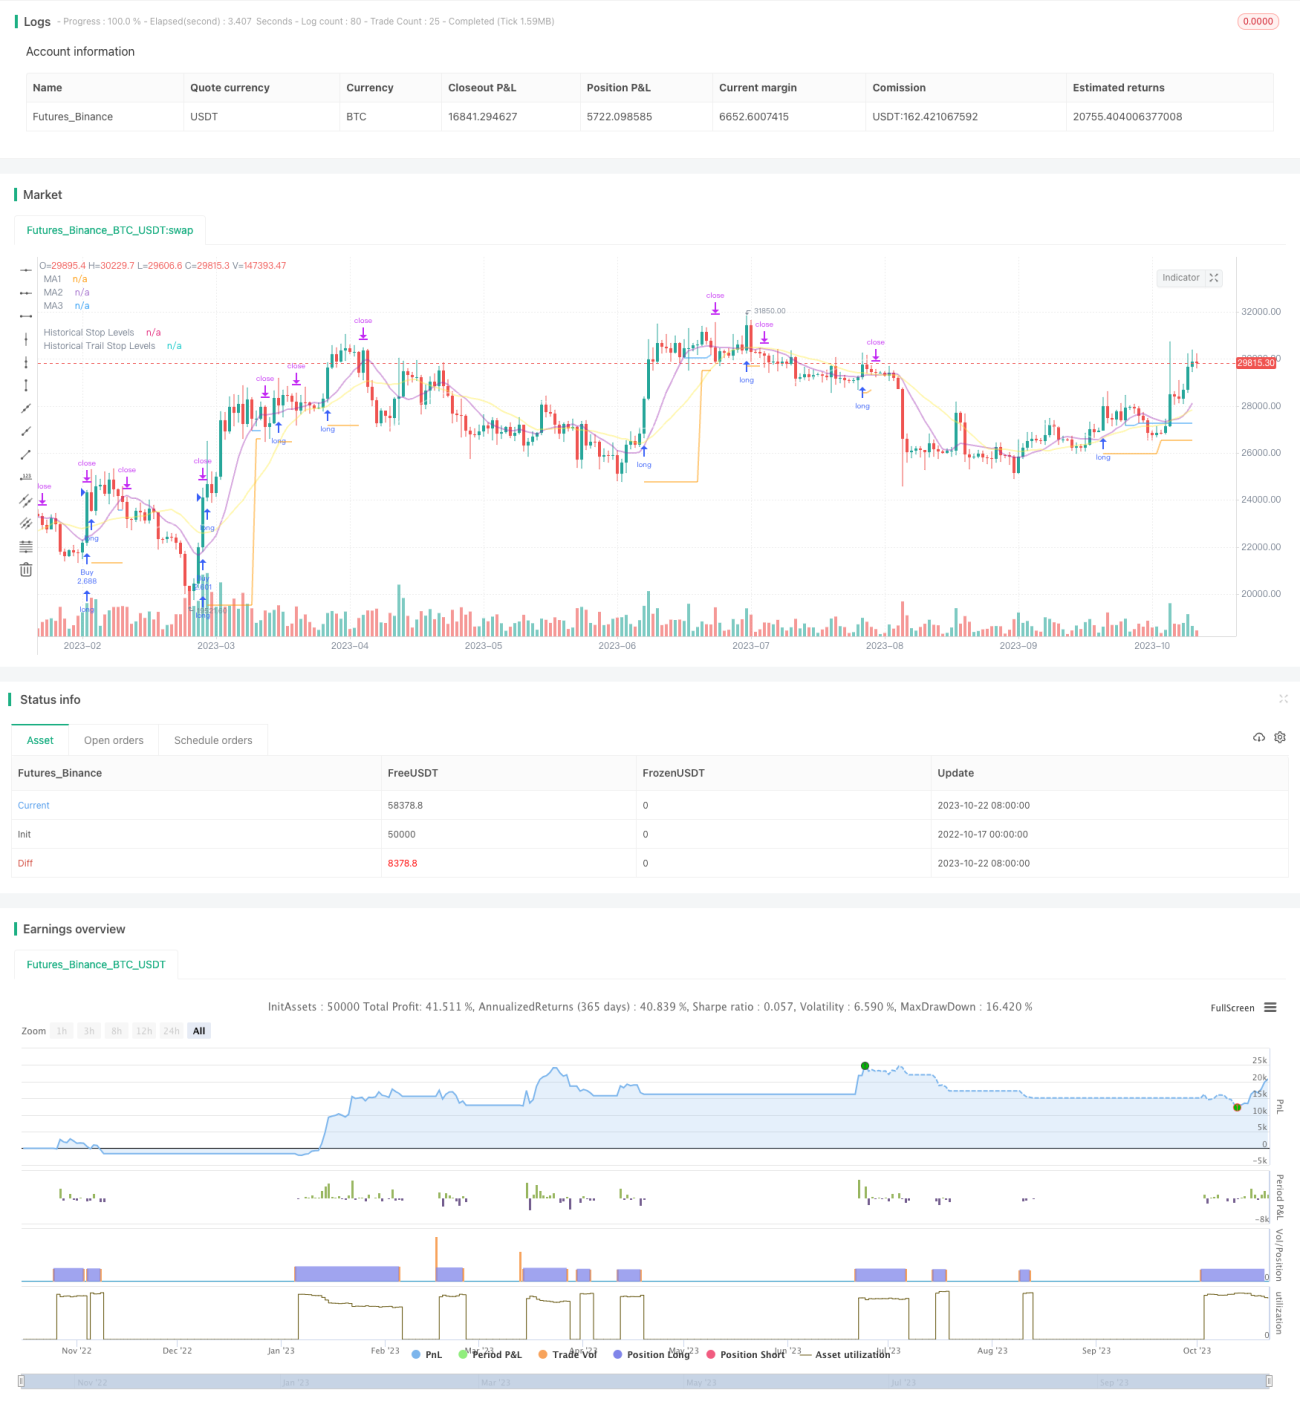
Исходный код стратегии
/*backtest
start: 2022-10-17 00:00:00
end: 2023-10-23 00:00:00
period: 1d
basePeriod: 1h
exchanges: [{"eid":"Futures_Binance","currency":"BTC_USDT"}]
*/

// This source code is subject to the terms of the Mozilla Public License 2.0 at https://mozilla.org/MPL/2.0/
// © millerrh

// The intent of this strategy is to buy breakouts with a tight stop on smaller timeframes in the direction of the longer term trend.
// Then use a trailing stop of a close below either the 10 MA or 20 MA (user choice) on that larger timeframe as the position 
// moves in your favor (i.e. whenever position price rises above the MA).
// Option of using daily ADR as a measure of finding contracting ranges and ensuring a decent risk/reward.
// (If the difference between the breakout point and your stop level is below a certain % of ATR, it could possibly find those consolidating periods.)
// V2 - updates code of original Qullamaggie Breakout to optimize and debug it a bit - the goal is to remove some of the whipsaw and poor win rate of the 
// original by incorporating some of what I learned in the Breakout Trend Follower script.

//@version=4
strategy("Qullamaggie Breakout V2", overlay=true, initial_capital=100000, currency='USD', calc_on_every_tick = true,
   default_qty_type=strategy.percent_of_equity, default_qty_value=100, commission_type=strategy.commission.percent, commission_value=0.1)
   
// === BACKTEST RANGE ===
Start = input(defval = timestamp("01 Jan 2019 06:00 +0000"), title = "Backtest Start Date", type = input.time, group = "backtest window and pivot history")
Finish = input(defval = timestamp("01 Jan 2100 00:00 +0000"), title = "Backtest End Date", type = input.time, group = "backtest window and pivot history")

// Inputs
showPivotPoints = input(title = "Show Historical Pivot Points?", type = input.bool, defval = false, group = "backtest window and pivot history",
  tooltip = "Toggle this on to see the historical pivot points that were used.  Change the Lookback Periods to adjust the frequency of these points.")
htf = input(defval="D", title="Timeframe of Moving Averages", type=input.resolution, group = "moving averages",
  tooltip = "Allows you to set a different time frame for the moving averages and your trailing stop.
  The default behavior is to identify good tightening setups on a larger timeframe
  (like daily) and enter the trade on a breakout occuring on a smaller timeframe, using the moving averages of the larger timeframe to trail your stop.")
maType = input(defval="SMA", options=["EMA", "SMA"], title = "Moving Average Type", group = "moving averages")
ma1Length = input(defval = 10, title = "1st Moving Average Length", minval = 1, group = "moving averages")
ma2Length = input(defval = 20, title = "2nd Moving Average Length", minval = 1, group = "moving averages")
ma3Length = input(defval = 50, title = "3rd Moving Average Length", minval = 1, group = "moving averages")
useMaFilter = input(title = "Use 3rd Moving Average for Filtering?", type = input.bool, defval = true, group = "moving averages",
  tooltip = "Signals will be ignored when price is under this slowest moving average.  The intent is to keep you out of bear periods and only
             buying when price is showing strength or trading with the longer term trend.")
trailMaInput = input(defval="1st Moving Average", options=["1st Moving Average", "2nd Moving Average"], title = "Trailing Stop", group = "stops",
  tooltip = "Initial stops after entry follow the range lows.  Once in profit, the trade gets more wiggle room and
  stops will be trailed when price breaches this moving average.")
trailMaTF = input(defval="Same as Moving Averages", options=["Same as Moving Averages", "Same as Chart"], title = "Trailing Stop Timeframe", group = "stops",
  tooltip = "Once price breaches the trail stop moving average, the stop will be raised to the low of that candle that breached. You can choose to use the
  chart timeframe's candles breaching or use the same timeframe the moving averages use. (i.e. if daily, you wait for the daily bar to close before setting
  your new stop level.)")
currentColorS = input(color.new(color.orange,50), title = "Current Range S/R Colors:    Support", type = input.color, group = "stops", inline = "lineColor")
currentColorR = input(color.new(color.blue,50), title = " Resistance", type = input.color, group = "stops", inline = "lineColor")

// Pivot lookback
lbHigh = 3
lbLow = 3

// MA Calculations (can likely move this to a tuple for a single security call!!)
ma(maType, src, length) =>
    maType == "EMA" ? ema(src, length) : sma(src, length) //Ternary Operator (if maType equals EMA, then do ema calc, else do sma calc)
ma1 = security(syminfo.tickerid, htf, ma(maType, close, ma1Length))
ma2 = security(syminfo.tickerid, htf, ma(maType, close, ma2Length))
ma3 = security(syminfo.tickerid, htf, ma(maType, close, ma3Length))

plot(ma1, color=color.new(color.purple, 60), style=plot.style_line, title="MA1", linewidth=2)
plot(ma2, color=color.new(color.yellow, 60), style=plot.style_line, title="MA2", linewidth=2)
plot(ma3, color=color.new(color.white, 60), style=plot.style_line, title="MA3", linewidth=2)

// === USE ADR FOR FILTERING ===
// The idea here is that you want to buy in a consolodating range for best risk/reward. So here you can compare the current distance between 
// support/resistance vs. the ADR and make sure you aren't buying at a point that is too extended.
useAdrFilter = input(title = "Use ADR for Filtering?", type = input.bool, defval = false, group = "adr filtering",
  tooltip = "Signals will be ignored if the distance between support and resistance is larger than a user-defined percentage of ADR (or monthly volatility
  in the stock screener). This allows the user to ensure they are not buying something that is too extended and instead focus on names that are consolidating more.")
adrPerc = input(defval = 120, title = "% of ADR Value", minval = 1, group = "adr filtering")
tableLocation = input(defval="Bottom", options=["Top", "Bottom"], title = "ADR Table Visibility", group = "adr filtering",
  tooltip = "Place ADR table on the top of the pane, the bottom of the pane, or off.")
adrValue = security(syminfo.tickerid, "D", sma((high-low)/abs(low) * 100, 21)) // Monthly Volatility in Stock Screener (also ADR)
adrCompare = (adrPerc * adrValue) / 100

// === PLOT SWING HIGH/LOW AND MOST RECENT LOW TO USE AS STOP LOSS EXIT POINT ===
ph = pivothigh(high, lbHigh, lbHigh)
pl = pivotlow(low, lbLow, lbLow)
highLevel = valuewhen(ph, high[lbHigh], 0)
lowLevel = valuewhen(pl, low[lbLow], 0)
barsSinceHigh = barssince(ph) + lbHigh
barsSinceLow = barssince(pl) + lbLow
timeSinceHigh = time[barsSinceHigh]
timeSinceLow = time[barsSinceLow]

//Removes color when there is a change to ensure only the levels are shown (i.e. no diagonal lines connecting the levels)
pvthis = fixnan(ph)
pvtlos = fixnan(pl)
hipc = change(pvthis) != 0 ? na : color.new(color.maroon, 0)
lopc = change(pvtlos) != 0 ? na : color.new(color.green, 0)

// Display Pivot lines
plot(showPivotPoints ? pvthis : na, color=hipc, linewidth=1, offset=-lbHigh, title="Top Levels")
plot(showPivotPoints ? pvthis : na, color=hipc, linewidth=1, offset=0, title="Top Levels 2")
plot(showPivotPoints ? pvtlos : na, color=lopc, linewidth=1, offset=-lbLow, title="Bottom Levels")
plot(showPivotPoints ? pvtlos : na, color=lopc, linewidth=1, offset=0, title="Bottom Levels 2")

// BUY AND SELL CONDITIONS
buyLevel = valuewhen(ph, high[lbHigh], 0) //Buy level at Swing High

// Conditions for entry
stopLevel = float(na) // Define stop level here as "na" so that I can reference it in the ADR calculation before the stopLevel is actually defined.
buyConditions = (useMaFilter ? buyLevel > ma3 : true) and
  (useAdrFilter ? (buyLevel - stopLevel[1]) < adrCompare : true) 
buySignal = crossover(high, buyLevel) and buyConditions

// Trailing stop points - when price punctures the moving average, move stop to the low of that candle - Define as function/tuple to only use one security call
trailMa = trailMaInput == "1st Moving Average" ? ma1 : ma2
f_getCross() =>
    maCrossEvent = crossunder(low, trailMa)
    maCross = valuewhen(maCrossEvent, low, 0)
    maCrossLevel = fixnan(maCross)
    maCrossPc = change(maCrossLevel) != 0 ? na : color.new(color.blue, 0) //Removes color when there is a change to ensure only the levels are shown (i.e. no diagonal lines connecting the levels)
    [maCrossEvent, maCross, maCrossLevel, maCrossPc]
crossTF = trailMaTF == "Same as Moving Averages" ? htf : ""
[maCrossEvent, maCross, maCrossLevel, maCrossPc] = security(syminfo.tickerid, crossTF, f_getCross())

plot(showPivotPoints ? maCrossLevel : na, color = maCrossPc, linewidth=1, offset=0, title="Ma Stop Levels")

// == STOP AND PRICE LEVELS ==
inPosition = strategy.position_size > 0
buyLevel := inPosition ? buyLevel[1] : buyLevel
stopDefine = valuewhen(pl, low[lbLow], 0) //Stop Level at Swing Low
inProfit = strategy.position_avg_price <= stopDefine[1]
// stopLevel := inPosition ? stopLevel[1] : stopDefine // Set stop loss based on swing low and leave it there
stopLevel := inPosition and not inProfit ? stopDefine : inPosition and inProfit ? stopLevel[1] : stopDefine // Trail stop loss until in profit
trailStopLevel = float(na)

// trying to figure out a better way for waiting on the trail stop - it can trigger if above the stopLevel even if the MA hadn't been breached since opening the trade
notInPosition = strategy.position_size == 0
inPositionBars = barssince(notInPosition)
maCrossBars = barssince(maCrossEvent)
trailCross = inPositionBars > maCrossBars
// trailCross = trailMa > stopLevel
trailStopLevel := inPosition and trailCross ? maCrossLevel : na

plot(inPosition ? stopLevel : na, style=plot.style_linebr, color=color.new(color.orange, 50), linewidth = 2, title = "Historical Stop Levels", trackprice=false)
plot(inPosition ? trailStopLevel : na, style=plot.style_linebr, color=color.new(color.blue, 50), linewidth = 2, title = "Historical Trail Stop Levels", trackprice=false)

// == PLOT SUPPORT/RESISTANCE LINES FOR CURRENT CHART TIMEFRAME ==
// Use a function to define the lines
// f_line(x1, y1, y2, _color) =>
//     var line id = na
//     line.delete(id)
//     id := line.new(x1, y1, time, y2, xloc.bar_time, extend.right, _color)

// highLine = f_line(timeSinceHigh, highLevel, highLevel, currentColorR)
// lowLine = f_line(timeSinceLow, lowLevel, lowLevel, currentColorS)


// == ADR TABLE ==
tablePos = tableLocation == "Top" ? position.top_right : position.bottom_right
var table adrTable = table.new(tablePos, 2, 1, border_width = 3)
lightTransp = 90
avgTransp   = 80
heavyTransp = 70
posColor = color.rgb(38, 166, 154)
negColor = color.rgb(240, 83, 80)
volColor = color.new(#999999, 0)

f_fillCellVol(_table, _column, _row, _value) =>
    _transp = abs(_value) > 7 ? heavyTransp : abs(_value) > 4 ? avgTransp : lightTransp
    _cellText = tostring(_value, "0.00") + "%\n" + "ADR"
    table.cell(_table, _column, _row, _cellText, bgcolor = color.new(volColor, _transp), text_color = volColor, width = 6)

srDistance = (highLevel - lowLevel)/highLevel * 100

f_fillCellCalc(_table, _column, _row, _value) =>
    _c_color = _value >= adrCompare ? negColor : posColor
    _transp = _value >= adrCompare*0.8 and _value <= adrCompare*1.2 ? lightTransp : 
      _value >= adrCompare*0.5 and _value < adrCompare*0.8 ? avgTransp :
      _value < adrCompare*0.5 ? heavyTransp :
      _value > adrCompare*1.2 and _value <= adrCompare*1.5 ? avgTransp :
      _value > adrCompare*1.5 ? heavyTransp : na
    _cellText = tostring(_value, "0.00") + "%\n" + "Range"
    table.cell(_table, _column, _row, _cellText, bgcolor = color.new(_c_color, _transp), text_color = _c_color, width = 6)

if barstate.islast
    f_fillCellVol(adrTable, 0, 0, adrValue)
    f_fillCellCalc(adrTable, 1, 0, srDistance)
    // f_fillCellVol(adrTable, 0, 0, inPositionBars)
    // f_fillCellCalc(adrTable, 1, 0, maCrossBars)

// == STRATEGY ENTRY AND EXIT ==
strategy.entry("Buy", strategy.long, stop = buyLevel, when = buyConditions)

stop = stopLevel > trailStopLevel ? stopLevel : close[1] > trailStopLevel and close[1] > trailMa ? trailStopLevel : stopLevel
strategy.exit("Sell", from_entry = "Buy", stop=stop)