Краткосрочная трендовая стратегия, основанная на принятии решений на основе многомерных индикаторов


Дата создания: 2023-10-25 15:31:30 Последнее изменение: 2023-10-25 15:31:30
Копировать: 0 Количество просмотров: 615
1
Подписаться
1617
Подписчики

Краткосрочная трендовая стратегия, основанная на принятии решений на основе многомерных индикаторов

Обзор

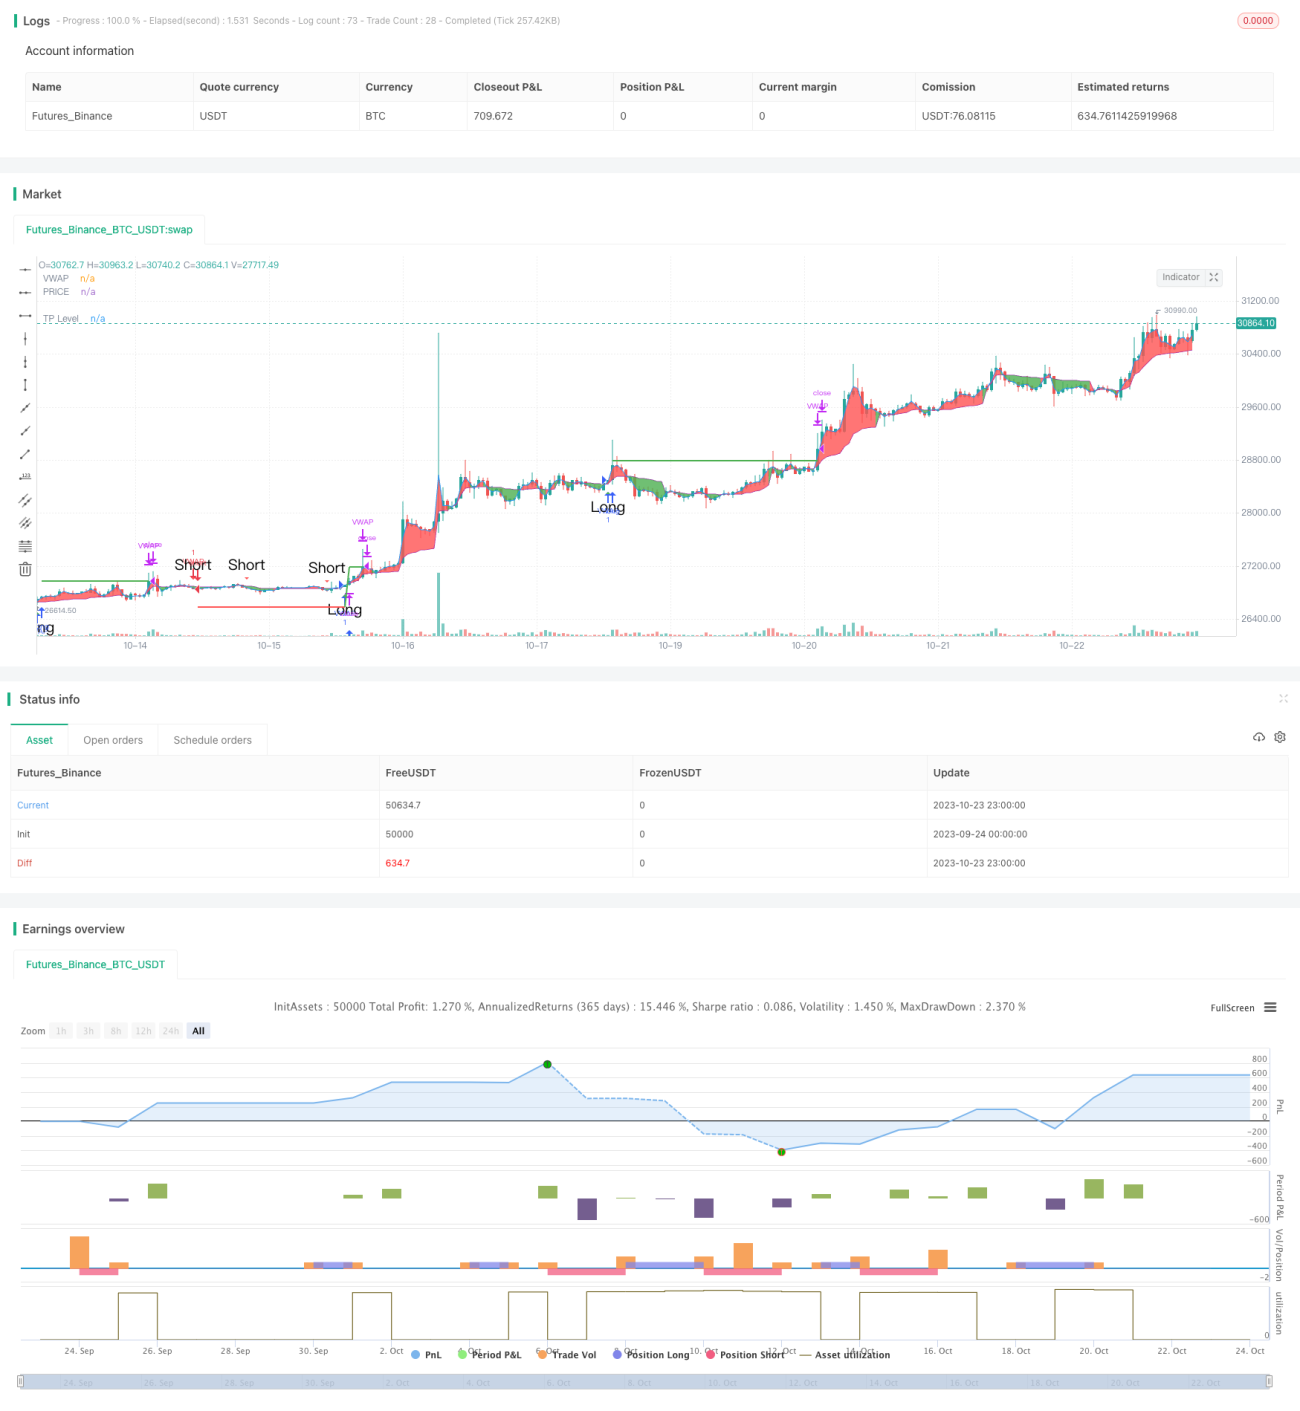
Эта стратегия объединяет три различных измерения технических показателей, а именно, поддерживающие сопротивление, среднелинейные системы и индикаторы перекупа и перепродажи, чтобы оценить направление краткосрочных тенденций на основе их комбинированных сигналов для получения более высокой выигрышной ставки.

Стратегический принцип

В коде сначала рассчитываются стойки поддержки и сопротивления цены, включая стандартную ось колебаний и стойки поддержки и сопротивления Фибоначчи, и изображаются на графике. Когда цена пробивает эти ключевые точки, это считается важным трендовым сигналом.

Затем рассчитывается весовая скользящая средняя VWAP и средняя цена, чтобы определить их золотой крест и мертвый крест. Это относится к среднесрочным и долгосрочным тенденциям.

Наконец, вычислите показатель Stochastic RSI, чтобы определить его золотое крестное и мертвое знаки, относящиеся к показателям перепродажи.

Комбинируя эти три измерения показателя, если поддерживающий уровень сопротивления, средняя линия VWAP и стохастический RSI одновременно посылают сигналы о покупке, открывается лишний ордер; если все три одновременно посылают сигналы о продаже, открывается пустой ордер.

Анализ преимуществ

Наибольшее преимущество этой стратегии заключается в том, что она объединяет три различных измерения показателя, что позволяет сделать выводы более всеобъемлющими и точными, а также повышает вероятность выигрыша. Во-первых, она поддерживает сопротивление, чтобы определить большую тенденцию; затем VWAP, чтобы определить среднюю длинную тенденцию; и, наконец, Stochastic RSI, чтобы определить перекуп и перепродажу.

Кроме того, в стратегии добавлена функция “стоп-ап”, которая позволяет блокировать определенный процент дохода, что полезно для управления капиталом.

Анализ рисков

Основная опасность этой стратегии заключается в том, что многообещающее решение зависит от синхронного сигнала индикатора, который может привести к ошибке в принятии решений, если часть индикатора посылает ошибочный сигнал. Например, Stochastic RSI посылает сигнал опережения, но VWAP и решение о сопротивлении поддержки остаются пессимистичными, и в этот момент можно пропустить покупку и не войти в игру.

Кроме того, неправильная настройка параметров индикатора также может привести к ошибке в оценке сигнала, и необходимо найти оптимальные параметры с помощью повторных отсчетов.

Кроме того, в краткосрочной перспективе на фондовом рынке часто происходят черные свинцовые события, в результате чего показатели неэффективны. Чтобы предотвратить этот риск, можно включить стратегию остановки убытков, чтобы избежать чрезмерного убытка.

Направление оптимизации

Эта стратегия может быть улучшена в следующих аспектах:

  1. Добавить дополнительные индикаторы, такие как показатели загрузки, чтобы оценить силу и слабость тенденций и повысить точность принятия решений.

  2. Добавление моделей машинного обучения, обучение многомерным показателям, автоматическое поиск оптимальной стратегии торговли.

  3. Оптимизируются в зависимости от параметров разных сортов, устанавливаются параметры адаптации.

  4. Увеличение стратегии стоп-лосса и улучшение управления рисками в зависимости от размера контрольных позиций для вывода.

  5. Оптимизируйте совокупность, найдите низко релевантные сорта для совокупности, уменьшите отзыв совокупности.

Подвести итог

Эта стратегия в целом очень подходит для торговли краткосрочными тенденциями. Она использует многомерные показатели для принятия решений, может отфильтровывать большое количество шума, имеет высокий коэффициент победы. Однако следует учитывать риск того, что показатели посылают ошибочные сигналы, и с помощью дальнейшей оптимизации эта стратегия может стать эффективной и стабильной короткой линией.

Исходный код стратегии
/*backtest
start: 2023-09-24 00:00:00
end: 2023-10-24 00:00:00
period: 1h
basePeriod: 15m
exchanges: [{"eid":"Futures_Binance","currency":"BTC_USDT"}]
*/

// EmperorBTC's VWAP Indicator & Strategy
//              v2.1
// 
//      coded by Bogdan Vaida

// This indicator was created after EmperorBTC's conditions on Twitter. 
// Good timeframes for it: 30', 15', 5'
// To convert from strategy to study switch the commented lines in the beginning
// and at the end of the script and vice versa.

// What this indicator does is to check if:
// o Pivot Point was crossed
// o Stoch-RSI and VWAP were crossed in current or previous candle
// o Candle (or previous candle) close is in the trend direction
// If all these are true then it will go long or short based on direction.


// FUTURE IDEAS: 
//  - Volume Expansion
//  - Candle Stick patterns

//@version=4

// 🔥Uncomment the line below for the indicator and comment the strategy lines
// study(title="EmperorBTC's VWAP Indicator", shorttitle="EMP-VWAP", overlay=true)

// 🔥 Uncomment the line below for the strategy and comment the above line
strategy(title="EmperorBTC's VWAP Strategy", shorttitle="EMP-VWAP", overlay=true, pyramiding=1)

plotAveragePriceCrossedPivotPoint = input(false, title="Plot Close Price Crossing Pivot Points?", group="Pivot Points")
plotPivotPoints = input(false, title="Plot Pivot Points?", group="Pivot Points")
pivotPointsType = input(title="Pivot Points type", defval="Fibonacci", options=["Fibonacci", "Traditional"], group="Pivot Points")

pivotPointCircleWidth = input(2, title="Width of Pivot Point circles", minval=1, group="Pivot Points")

plotVWAP = input(true, title="Plot VWAP?", group="VWAP")
plotAvgPrice = input(true, title="Plot Average Price?", group="VWAP")
plotVWAPCrossPrice = input(false, title="Plot Price Crossing VWAP?", group="VWAP")
reso = input(title="Period", type=input.resolution, defval="D", group="VWAP")
cumulativePeriod = input(14, "VWAP Cumulative Period", group="VWAP")

plotStochRSICross = input(false, title="Plot StochRSI Cross?", group="StochRSI")
smoothK = input(3, "K", minval=1, group="StochRSI", inline="K&D")
smoothD = input(3, "D", minval=1, group="StochRSI", inline="K&D")
lengthRSI = input(14, "RSI Length", minval=1, group="Stochastic-RSI", inline="length")
lengthStoch = input(14, "Stochastic Length", minval=1, group="Stochastic-RSI", inline="length")
rsiSrc = input(close, title="RSI Source", group="Stochastic-RSI")

plotLong = input(true, title="Plot Long Opportunity?", group="Strategy only")
plotShort = input(true, title="Plot Short Opportunity?", group="Strategy only")
tradingDirection = input(title="Strategy trading Direction: ", defval="L&S", options=["L&S", "L", "S"], group="Strategy only")
takeProfit = input(1.0, title='Take Profit %', group="Strategy only") / 100
plotTP = input(true, title="Plot Take Profit?", group="Strategy only")
startDate = input(title="Start Date", type=input.integer,
     defval=1, minval=1, maxval=31, group="Backtesting range", inline="Start Date")
startMonth = input(title="Start Month", type=input.integer,
     defval=1, minval=1, maxval=12, group="Backtesting range", inline="Start Date")
startYear = input(title="Start Year", type=input.integer,
     defval=2017, minval=1800, maxval=2100, group="Backtesting range", inline="Start Date")
endDate = input(title="End Date", type=input.integer,
     defval=31, minval=1, maxval=31, group="Backtesting range", inline="End Date")
endMonth = input(title="End Month", type=input.integer,
     defval=12, minval=1, maxval=12, group="Backtesting range", inline="End Date")
endYear = input(title="End Year", type=input.integer,
     defval=2050, minval=1800, maxval=2100, group="Backtesting range", inline="End Date")


// PivotPoint code (PVTvX by DGT has some nice code on PP)
candleHigh  = security(syminfo.tickerid,"D", high[1], lookahead=barmerge.lookahead_on)
candleLow   = security(syminfo.tickerid,"D", low[1], lookahead=barmerge.lookahead_on)
candleClose = security(syminfo.tickerid,"D", close[1], lookahead=barmerge.lookahead_on)

pivotPoint = (candleHigh+candleLow+candleClose) / 3

float resistance1 = na
float resistance2 = na
float resistance3 = na
float support1 = na
float support2 = na
float support3 = na

if pivotPointsType == "Fibonacci"
    resistance1 := pivotPoint + 0.382 * (candleHigh - candleLow)
    resistance2 := pivotPoint + 0.618 * (candleHigh - candleLow)
    resistance3 := pivotPoint + (candleHigh - candleLow)
    support1 := pivotPoint - 0.382 * (candleHigh - candleLow)
    support2 := pivotPoint - 0.618 * (candleHigh - candleLow)
    support3 := pivotPoint - (candleHigh - candleLow)
else if pivotPointsType == "Traditional"
    resistance1 := 2 * pivotPoint - candleLow
    resistance2 := pivotPoint + (candleHigh - candleLow)
    resistance3 := candleHigh + 2 * (pivotPoint - candleLow) 
    support1 := 2 * pivotPoint - candleHigh
    support2 := pivotPoint - (candleHigh - candleLow)
    support3 := candleLow - 2 * (candleHigh - pivotPoint)

plot(series = plotPivotPoints ? support1 : na, color=#ff0000, title="S1", style = plot.style_circles, linewidth = pivotPointCircleWidth)
plot(series = plotPivotPoints ? support2 : na, color=#800000, title="S2", style = plot.style_circles, linewidth = pivotPointCircleWidth)
plot(series = plotPivotPoints ? support3 : na, color=#330000, title="S3", style = plot.style_circles, linewidth = pivotPointCircleWidth)
plot(series = plotPivotPoints ? pivotPoint : na, color=#FFA500, title="PP", style = plot.style_circles, linewidth = pivotPointCircleWidth)
plot(series = plotPivotPoints ? resistance1 : na, color=#00FF00, title="R1", style = plot.style_circles, linewidth = pivotPointCircleWidth)
plot(series = plotPivotPoints ? resistance2 : na, color=#008000, title="R2", style = plot.style_circles, linewidth = pivotPointCircleWidth)
plot(series = plotPivotPoints ? resistance3 : na, color=#003300, title="R3", style = plot.style_circles, linewidth = pivotPointCircleWidth)

pivotPointCrossedUp = ((low < support3) and (close > support3)) or ((low < support2) and (close > support2)) or ((low < support1) and (close > support1)) or  ((low < pivotPoint) and (close > pivotPoint))
pivotPointCrossedDown = ((high > support3) and (close < support3)) or ((high > support2) and (close < support2)) or ((high > support1) and (close < support1)) or  ((high > pivotPoint) and (close < pivotPoint))
plotPPColor = pivotPointCrossedUp ? color.green :
     pivotPointCrossedDown ? color.red :
     na

plotshape(series = plotAveragePriceCrossedPivotPoint ? (pivotPointCrossedUp or pivotPointCrossedDown) : na, title="PP Cross", style = shape.triangleup, location=location.belowbar, color=plotPPColor, text="PP", size=size.small)

// VWAP (taken from the TV code)
// There are five steps in calculating VWAP:
//
// 1. Calculate the Typical Price for the period. [(High + Low + Close)/3)]
// 2. Multiply the Typical Price by the period Volume (Typical Price x Volume)
// 3. Create a Cumulative Total of Typical Price. Cumulative(Typical Price x Volume)
// 4. Create a Cumulative Total of Volume. Cumulative(Volume)
// 5. Divide the Cumulative Totals. 
//
// VWAP = Cumulative(Typical Price x Volume) / Cumulative(Volume)

// Emperor's Edition
t = time(reso)
debut = na(t[1]) or t > t[1]

addsource = ohlc4 * volume
addvol = volume
addsource := debut ? addsource : addsource + addsource[1]
addvol := debut ? addvol : addvol + addvol[1]
vwapValue = addsource / addvol

pVWAP = plot(series = plotVWAP ? vwapValue : na, color=color.purple, title="VWAP")
pAvgPrice = plot(series = plotAvgPrice ? ohlc4 : na, color=color.blue, title="PRICE")
fill(pVWAP, pAvgPrice, color = ohlc4 > vwapValue ? color.red : color.green, title="VWAP PRICE FILL")

vwapCrossUp = (low < vwapValue) and (vwapValue < high) and (close > open) // added green candle check
vwapCrossDown = (high > vwapValue) and (vwapValue > low) and (close < open) // added red candle check

plotVWAPColor = vwapCrossUp ? color.green :
     vwapCrossDown ? color.red :
     na
plotshape(series = plotVWAPCrossPrice ? (vwapCrossUp or vwapCrossDown) : na, title="VWAP Cross Price", style=shape.triangleup, location=location.belowbar, color=plotVWAPColor, text="VWAP", size=size.small)


// Stochastic RSI

rsi1 = rsi(rsiSrc, lengthRSI)
k = sma(stoch(rsi1, rsi1, rsi1, lengthStoch), smoothK)
d = sma(k, smoothD)

sRsiCrossUp = k[1] < d[1] and k > d
sRsiCrossDown = k[1] > d[1] and k < d

plotColor = sRsiCrossUp ? color.green :
     sRsiCrossDown ? color.red :
     na
plotshape(series = plotStochRSICross ? (sRsiCrossUp or sRsiCrossDown) : na, title="StochRSI Cross Up", style=shape.triangleup, location=location.belowbar, color=plotColor, text="StochRSI", size=size.small)

// Long Trades
sRsiCrossedUp = sRsiCrossUp or sRsiCrossUp[1]
vwapCrossedUp = vwapCrossUp or vwapCrossUp[1]
// longCond1 = (sRsiCross and vwapCross) or (sRsiCross[1] and vwapCross) or (sRsiCross and vwapCross[1])
longCond1 = (sRsiCrossedUp[1] and vwapCrossedUp[1])
longCond2 = pivotPointCrossedUp[1]
longCond3 = (close[1] > open[1]) and (close > open) // check this
longCond = longCond1 and longCond2 and longCond3
plotshape(series = plotLong ? longCond : na, title="Long", style=shape.triangleup, location=location.belowbar, color=color.green, text="Long", size=size.normal)

// Short Trades
sRsiCrossedDown = sRsiCrossDown or sRsiCrossDown[1]
vwapCrossedDown = vwapCrossDown or vwapCrossDown[1]
shortCond1 = (sRsiCrossedDown[1] and vwapCrossedDown[1])
shortCond2 = pivotPointCrossedDown[1]
shortCond3 = (close[1] < open[1]) and (close < open)
shortCond = shortCond1 and shortCond2 and shortCond3
plotshape(series = plotShort ? shortCond : na, title="Short", style=shape.triangledown, location=location.abovebar, color=color.red, text="Short", size=size.normal)

// alertcondition(condition=longCond, title="Long", message="Going long")
// alertcondition(condition=shortCond, title="Short", message="Going short")

// 🔥 Uncomment the lines below for the strategy and revert for the study
takeProfitLong     = strategy.position_avg_price * (1 + takeProfit)
takeProfitShort     = strategy.position_avg_price * (1 - takeProfit)
exitTp = ((strategy.position_size > 0) and (close > takeProfitLong)) or ((strategy.position_size < 0) and (close < takeProfitShort))
strategy.risk.allow_entry_in(tradingDirection == "L" ? strategy.direction.long : tradingDirection == "S" ? strategy.direction.short : strategy.direction.all)
plot(series = (plotTP and strategy.position_size > 0) ? takeProfitLong : na, title="TP Level",color=color.green, style=plot.style_linebr, linewidth=2)
plot(series = (plotTP and strategy.position_size < 0) ? takeProfitShort : na, title="TP Level",color=color.red, style=plot.style_linebr, linewidth=2)
inDateRange = (time >= timestamp(syminfo.timezone, startYear,
         startMonth, startDate, 0, 0)) and (time < timestamp(syminfo.timezone, endYear, endMonth, endDate, 0, 0))
strategy.entry("VWAP", strategy.long, comment="Long", when=longCond and inDateRange)
strategy.entry("VWAP", strategy.short, comment="Short", when=shortCond and inDateRange)
strategy.close(id="VWAP", when=exitTp)
if (not inDateRange)
    strategy.close_all()