
Стратегия направлена на то, чтобы обеспечить управление стоп-стоп в течение нескольких временных рамок. Стратегия одновременно использует стоп-стоп в процентном соотношении и стоп-стоп в ключевых ценовых зонах выше основных временных рамок для более точного и эффективного управления стоп-стоп-стоп.
В первую очередь в стратегию вводятся индикаторы волнового тренда, в соответствии с которыми проводится многосигнальное вхождение в рынок.
В рамках стратегии по борьбе с дезинфекцией используются два способа:
Процентная остановка: устанавливается несколько стоп-цен в зависимости от определенного процента от цены входа.
Стоп-цены многовременных рамок: на графике дневных и 4-часовых часовых линий нанесены средние линии, а цены этих средних линий используются в качестве стоп-цены.
Для стоп-стоп стратегия устанавливает 4 различных стоп-цены в процентах. Когда цена касается каждой стоп-цены, она частично ликвидируется в соответствии с установленным процентом.
Для многовременных стоп-фрейм стратегии состоят в том, чтобы нарисовать 100-дневную среднюю линию и 200-дневную среднюю линию на дневной и 4-часовой линиях соответственно. Принимая цены этих средних линий в качестве стоп-цены, при достижении цены, они должны быть сброшены.
Кроме того, стратегия устанавливает цену стоп-лосса. Когда цена ниже цены стоп-лосса, все позиции ликвидируются.
В целом стратегия позволяет более полно и точно управлять сдерживанием, используя комбинацию сдерживания процентной долей и сдерживания в нескольких временных рамках.
Используйте процентное сцепление, сцепление по фиксированной пропорции, чтобы избежать преждевременного или недостаточного сцепления.
С помощью анализа многократных временных рамок можно установить более точные цены остановок и выбрать лучшие остановочные точки.
Многоуровневые противогрибковые препараты позволяют снизить риск.
Установка стоп-стоп и эффективный контроль риска падения.
Комбинированное использование процентного торможения и многовременного торможения приводит к более полному и утонченному торможению.
Процентная остановка зависит от параметров, если параметры установлены неправильно, это может привести к слишком ранней или слишком поздней остановке.
Анализ многократных временных рамок зависит от среднелинейных показателей, которые имеют определенную задержку и могут отклоняться.
Неправильная установка стоп-позиции может привести к ненужным потерям.
Необходима надлежащая оптимизация параметров, чтобы оптимально соответствовать процентному и многовременному торможению.
Можно проверить больше средних линий и выбрать лучшую среднюю линию в качестве ключевой остановки.
Можно попробовать методы модельного прогнозирования, прогнозируя ценовые ключевые области в качестве остановочных цен.
Можно ввести больше правил, таких как ожидаемая пропорция остановки, движущаяся остановка и т.д., чтобы остановка была более полной.
Можно проверить оптимальные параметры стоп-процентов при различных периодах хранения позиций.
Можно оптимизировать параметры торможения путем обратной связи, чтобы общий риск был выше, чем прибыль.
Эта стратегия обеспечивает гибкое и точное управление остановкой путем комбинирования процентной остановки и многовременной остановки. У этой стратегии есть преимущества, такие как лучший выбор остановки и более полная остановка. В то же время существуют такие проблемы, как настройка параметров, положение остановки. Впоследствии можно улучшить систему остановки стратегии, оптимизировав параметры остановки, добавив больше правил остановки и т. Д.
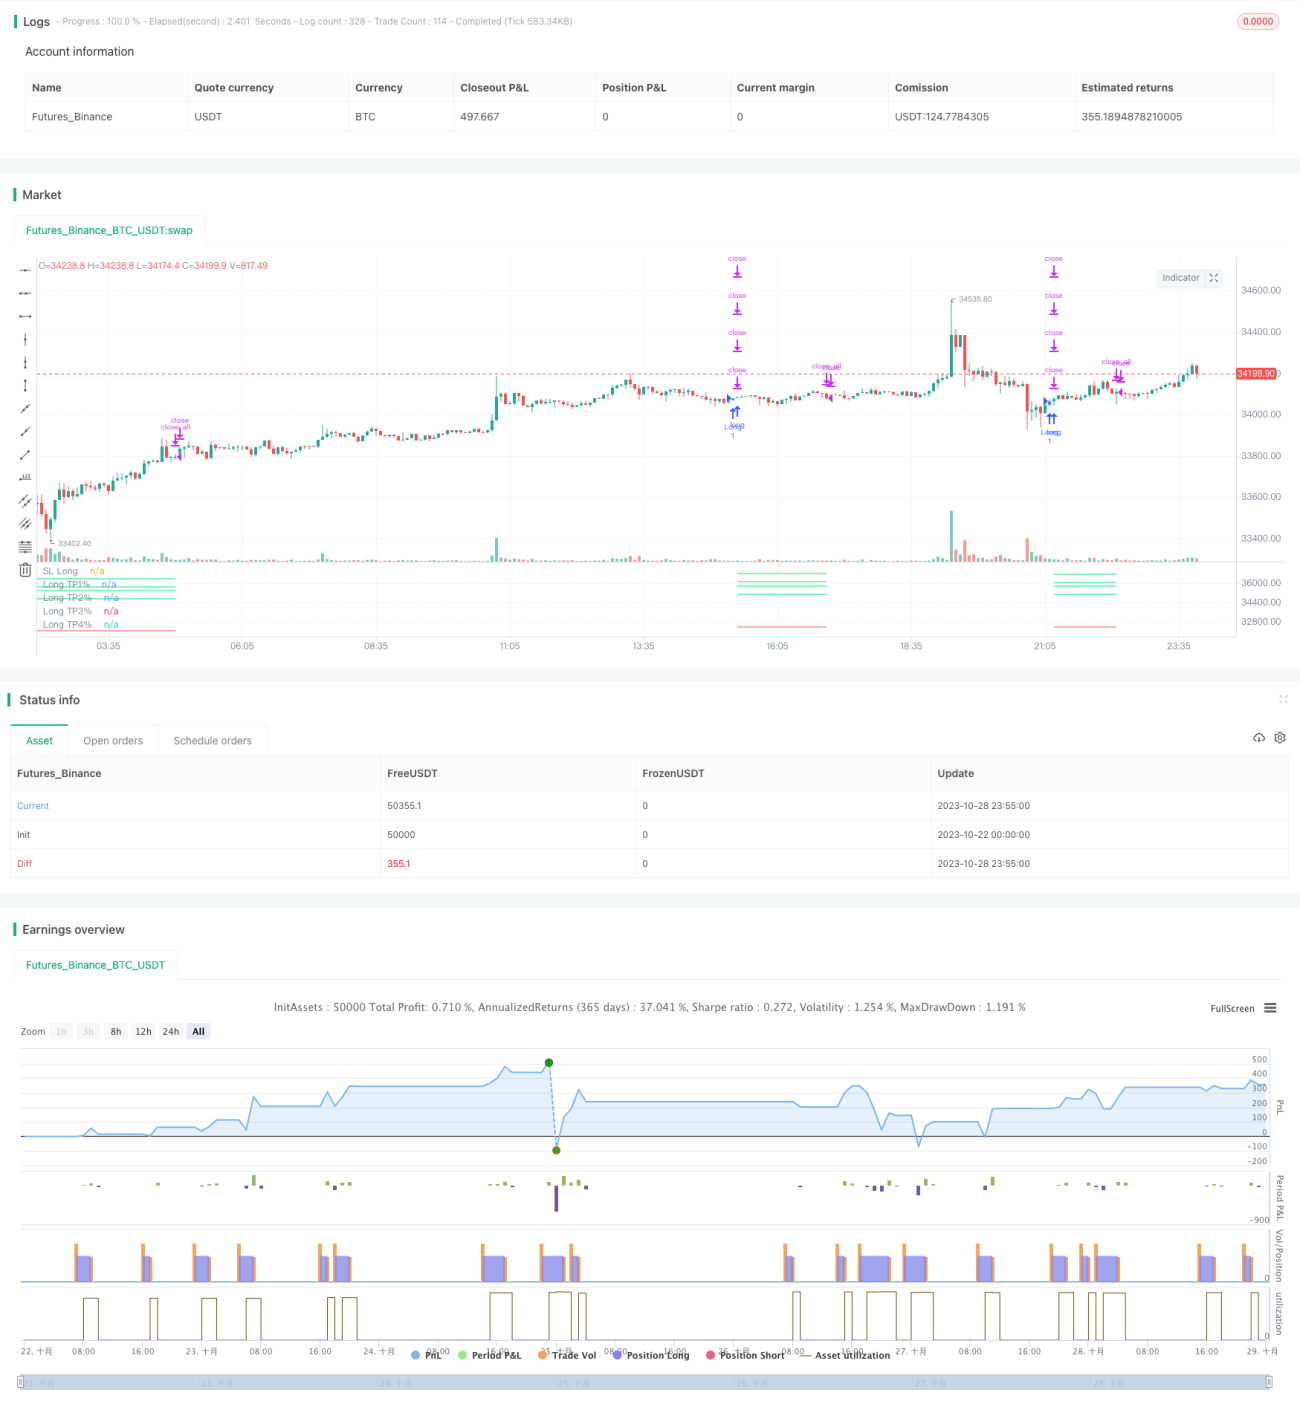
/*backtest
start: 2023-10-22 00:00:00
end: 2023-10-29 00:00:00
period: 5m
basePeriod: 1m
exchanges: [{"eid":"Futures_Binance","currency":"BTC_USDT"}]
*/
// This source code is subject to the terms of the Mozilla Public License 2.0 at https://mozilla.org/MPL/2.0/
// © TrendCrypto2022
//@version=5
// strategy("Take profit Multi timeframe", overlay=true, margin_long=100, margin_short=100)
takepercent = input.bool(title="Take profit %", defval=true ,group="Set up take profit")
takemtf = input.bool(title="Take profit Multi timeframe", defval=false ,group="Set up take profit")
//Paste your strategy at here. This is example strategy. I use WaveTrend indicator
//WaveTrend indicator
n1 = input(10, "Channel Length")
n2 = input(21, "Average Length")
oblv1 = input(60, "Over Bought Lv 1")
oblv2 = input(53, "Over Bought Lv 2")
oslv1 = input(-60, "Over Sold Lv 1")
oslv2 = input(-53, "Over Sold Lv 2")
ap = hlc3
esa = ta.ema(ap, n1)
d = ta.ema(math.abs(ap - esa), n1)
ci = (ap - esa) / (0.015 * d)
tci = ta.ema(ci, n2)
wt1 = tci
wt2 = ta.sma(wt1,4)
//Strategy
buy = ta.crossover(wt1, wt2) and wt1 < -40
if (buy)
strategy.entry("Long", strategy.long)
//Resistant in time D and 4H
ema_len1 = input.int(title='Ema1', defval=100, group='Take profit Mtf')
ema_len2 = input.int(title='Ema2', defval=200, group='Take profit Mtf')
src = input.source(title='Source', defval=close, group='Take profit Mtf')
tf1 = input.timeframe(title='Time frame 1', defval='240', group='Take profit Mtf')
tf2 = input.timeframe(title='Time frame 2', defval='D', group='Take profit Mtf')
htf_ma1 = ta.ema(src, ema_len1)
htf_ma2 = ta.ema(src, ema_len2)
ema1 = request.security(syminfo.tickerid, tf1, htf_ma1)
ema2 = request.security(syminfo.tickerid, tf1, htf_ma2)
ema3 = request.security(syminfo.tickerid, tf2, htf_ma1)
ema4 = request.security(syminfo.tickerid, tf2, htf_ma2)
//Plot
plotema1 = plot(ema1, color=color.new(color.silver, 0), style=plot.style_line, linewidth=1, offset=0, title='Ema100 4h', display=display.none)
plotema2 = plot(ema2, color=color.new(color.silver, 0), style=plot.style_line, linewidth=1, offset=0, title='Ema200 4h', display=display.none)
plotema3 = plot(ema3, color=color.new(color.orange, 20), style=plot.style_line, linewidth=1, offset=0, title='Ema100 D', display=display.none)
plotema4 = plot(ema4, color=color.new(color.orange, 20), style=plot.style_line, linewidth=1, offset=0, title='Ema200 D', display=display.none)
//Label take profit multitime frame
var label labelema1 = na
label.delete(labelema1)
labelema1 := label.new(x=time + 120, y=ema1, text='\n*****Ema100 4H: ' + str.tostring(math.round(ema1,4)) + '', color=color.new(#000000, 100), textcolor = color.yellow, size=size.small, style=label.style_label_left, xloc=xloc.bar_time, yloc=yloc.price)
var label labelema2 = na
label.delete(labelema2)
labelema2 := label.new(x=time + 120, y=ema2, text='\n*****Ema200 4H: ' + str.tostring(math.round(ema2,4)) + '', color=color.new(#000000, 100), textcolor = color.yellow, size=size.small, style=label.style_label_left, xloc=xloc.bar_time, yloc=yloc.price)
var label labelema3 = na
label.delete(labelema3)
labelema3 := label.new(x=time + 120, y=ema3, text='\n*****Ema100 1D: ' + str.tostring(math.round(ema3,4)) + '', color=color.new(#000000, 100), textcolor = color.yellow, size=size.small, style=label.style_label_left, xloc=xloc.bar_time, yloc=yloc.price)
var label labelema4 = na
label.delete(labelema4)
labelema4 := label.new(x=time + 120, y=ema4, text='\n*****Ema200 1D: ' + str.tostring(math.round(ema4,4)) + '', color=color.new(#000000, 100), textcolor = color.yellow, size=size.small, style=label.style_label_left, xloc=xloc.bar_time, yloc=yloc.price)
//Set up take profit %
percent(pcnt) =>
strategy.position_size != 0 ? math.round(pcnt / 100 * strategy.position_avg_price / syminfo.mintick) : float(na)
TP1=input.float(3, title="TP1 %", step=0.1, group="Take profit %")
TP2=input.float(5, title="TP2 %", step=1, group="Take profit %")
TP3=input.float(6, title="TP3 %", step=1, group="Take profit %")
TP4=input.float(8, title="TP4 %", step=1, group="Take profit %")
SL=input.float(5, title="Stop Loss %", step=1, group="Take profit %")
qty1=input.float(5, title="% Close At TP1", step=1, group="Take profit %")
qty2=input.float(5, title="% Close At TP2", step=1, group="Take profit %")
qty3=input.float(5, title="% Close At TP3", step=1, group="Take profit %")
qty4=input.float(5, title="% Close At TP4", step=1, group="Take profit %")
lossPnt_L = percent(SL)
//Set up take profit multi timeframe
a = array.from((ema1), (ema2), (ema3), (ema4))
tpmtf1 = array.min(a)
tpmtf2 = array.min(a, 2)
tpmtf3 = array.min(a, 3)
tpmtf4 = array.min(a, 4)
//Set up exit
long_sl_level = strategy.position_avg_price - lossPnt_L*syminfo.mintick
if takepercent == true
strategy.exit("TP1%", "Long", qty_percent = qty1, profit = percent(TP1), loss = lossPnt_L)
strategy.exit("TP2%", "Long", qty_percent = qty2, profit = percent(TP2), loss = lossPnt_L)
strategy.exit("TP3%", "Long", qty_percent = qty3, profit = percent(TP3), loss = lossPnt_L)
strategy.exit("TP4%", "Long", qty_percent = qty4, profit = percent(TP3), loss = lossPnt_L)
strategy.close_all(when= ta.crossunder(wt1, wt2) and wt1 > 0, comment="Close All")
if takemtf == true and array.max(a, 1) > strategy.position_avg_price
strategy.exit("TP1Mtf", "Long", qty_percent = qty1, limit = tpmtf1, stop = long_sl_level)
strategy.exit("TP2Mtf", "Long", qty_percent = qty2, limit = tpmtf2, stop = long_sl_level)
strategy.exit("TP3Mtf", "Long", qty_percent = qty3, limit = tpmtf3, stop = long_sl_level)
strategy.close_all(when= ta.crossunder(wt1, wt2) and wt1 > 0, comment="Close All")
// Plot TP & SL
long_tp1_level = strategy.position_avg_price + percent(TP1)*syminfo.mintick
long_tp2_level = strategy.position_avg_price + percent(TP2)*syminfo.mintick
long_tp3_level = strategy.position_avg_price + percent(TP3)*syminfo.mintick
long_tp4_level = strategy.position_avg_price + percent(TP4)*syminfo.mintick
plot(strategy.position_size > 0 ? long_sl_level : na, color=color.red, style=plot.style_linebr, title="SL Long")
plot(strategy.position_size > 0 ? long_tp1_level : na, color=color.lime, style=plot.style_linebr, title="Long TP1%")
plot(strategy.position_size > 0 ? long_tp2_level : na, color=color.lime, style=plot.style_linebr, title="Long TP2%")
plot(strategy.position_size > 0 ? long_tp3_level : na, color=color.lime, style=plot.style_linebr, title="Long TP3%")
plot(strategy.position_size > 0 ? long_tp4_level : na, color=color.lime, style=plot.style_linebr, title="Long TP4%")
plot(strategy.position_size > 0 ? tpmtf1 : na, color=color.orange, style=plot.style_linebr, title="Long TP1Mtf", display = display.none)
plot(strategy.position_size > 0 ? tpmtf2 : na, color=color.orange, style=plot.style_linebr, title="Long TP2Mtf", display = display.none)
plot(strategy.position_size > 0 ? tpmtf3 : na, color=color.orange, style=plot.style_linebr, title="Long TP3Mtf", display = display.none)
//Label TP
if strategy.position_size > 0
var label labellongtp1 = na
label.delete(labellongtp1)
labellongtp1 := label.new(x=time + 120, y=long_tp1_level, text='\nTP1: ' + str.tostring(math.round(long_tp1_level,2)) + '', color=color.new(#000000, 100), textcolor = color.lime, size=size.small, style=label.style_label_left, xloc=xloc.bar_time, yloc=yloc.price)
var label labellongtp2 = na
label.delete(labellongtp2)
labellongtp2 := label.new(x=time + 120, y=long_tp2_level, text='\nTP2: ' + str.tostring(math.round(long_tp2_level,2)) + '', color=color.new(#000000, 100), textcolor = color.lime, size=size.small, style=label.style_label_left, xloc=xloc.bar_time, yloc=yloc.price)
var label labellongtp3 = na
label.delete(labellongtp3)
labellongtp3 := label.new(x=time + 120, y=long_tp3_level, text='\nTP3: ' + str.tostring(math.round(long_tp3_level,2)) + '', color=color.new(#000000, 100), textcolor = color.lime, size=size.small, style=label.style_label_left, xloc=xloc.bar_time, yloc=yloc.price)
var label labellongtp4 = na
label.delete(labellongtp4)
labellongtp4 := label.new(x=time + 120, y=long_tp4_level, text='\nTP4: ' + str.tostring(math.round(long_tp4_level,2)) + '', color=color.new(#000000, 100), textcolor = color.lime, size=size.small, style=label.style_label_left, xloc=xloc.bar_time, yloc=yloc.price)